.svg)


Market Insights Snapshot
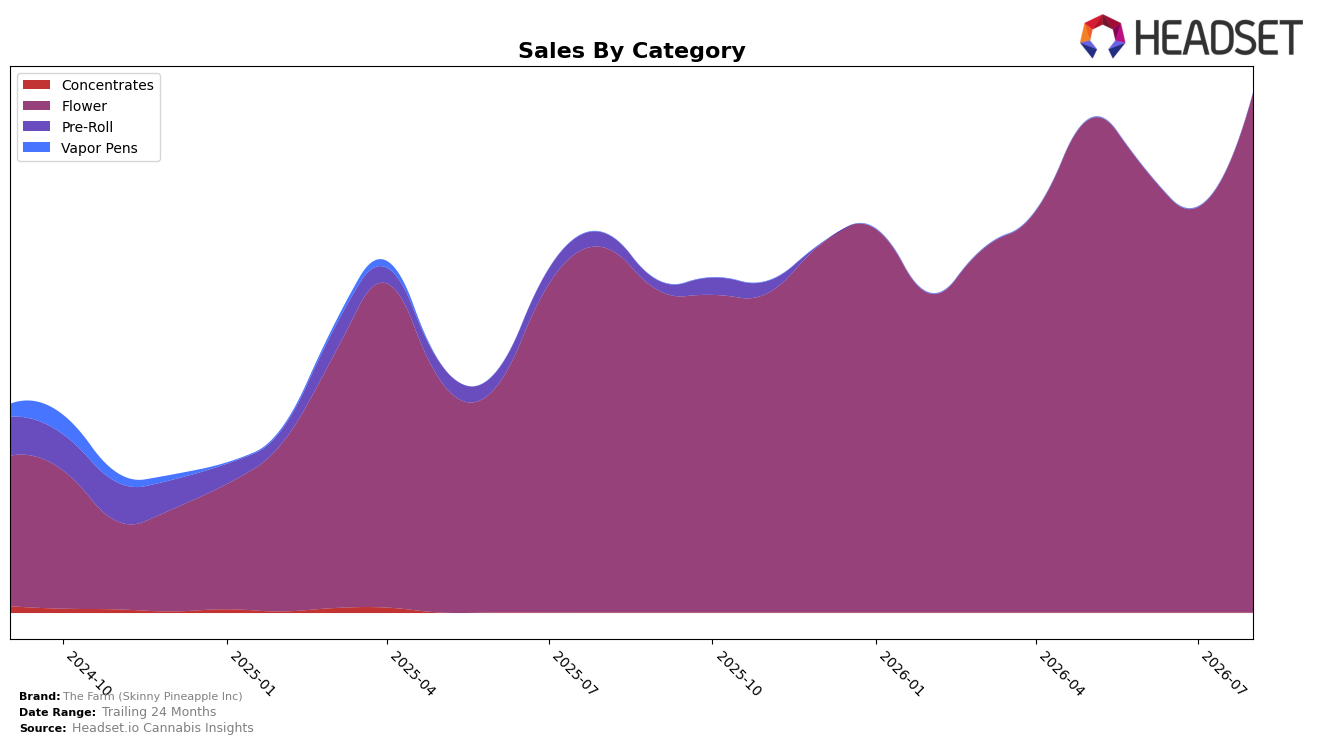
In August 2026, The Farm (Skinny Pineapple Inc) concentrated 100.0% of sales in Flower, with year-over-year sales up 42.4% and month-over-month sales up 28.2%. Average price rose 37.7% YoY to $32.89, while overall brand sales advanced 37.1% YoY, indicating that mix and pricing, not diversification, drove gains. Within Colorado Flower, the brand held rank 34, and its 24-month sales growth of 122.8% contrasts with a single-category footprint holding steady at 100.0% share of mix. The pattern implies The Farm (Skinny Pineapple Inc) is scaling inside one category via price-led and volume-linked gains rather than spreading risk across adjacent formats.
The shift toward higher average price (+37.7% YoY) alongside a 28.2% MoM sales lift suggests pricing power within Flower, yet the 42.4% YoY category growth outpacing the 37.1% YoY brand total signals reliance on Flower concentration rather than multi-category expansion. Holding rank 34 in Colorado Flower while keeping 100.0% of mix in that category implies mid-pack visibility anchored in a single lane, and the 122.8% 24-month sales increase shows momentum that could stall if price elasticity tightens. The implication is a positioning centered on premium-leaning Flower that benefits from current demand and pricing, but with exposure to any rank slippage or price compression given the absence of category hedges.
Competitive Landscape
In August 2026, The Farm (Skinny Pineapple Inc) sits at rank #34 in CO Flower, improving 14 positions year over year from #48, while the 3-month position was #35 and the brand’s peak rank matched the current at #34 in August 2026. Against the leaderboard, Seed & Strain Cannabis Co. rose from #2 to #1 with 44.8% YoY sales growth, whereas Green Label Cannabis slipped from #1 to #2 with 1.3% YoY growth, and Green Dot Labs climbed from #5 to #3 with 36.5% YoY growth. The Farm’s 14-rank YoY climb alongside a 1-position improvement over the last three months indicates traction but also a widening performance gap versus top rivals that are consolidating share at ranks #1–#3, implying the current trajectory sustains mid-pack status without a step-change in velocity.

Notable Products
Ice Cream Cake (14g) posted the clearest surge in August 2026 with +97.8% month over month to rank 2, while Mob Boss (14g) also jumped +92.9% to rank 3, signaling velocity gains concentrated at the top of the chart. Penny's Pie (14g) held rank 1 without a reported MoM figure, and Original Glue (14g) in a tie at rank 6 advanced +12.6%, indicating breadth beyond a single spike. Nine of the top ten are Flower SKUs, and two Penny's Pie sizes appear in the top ten, implying a portfolio weighted toward repeatable Flower formats rather than fragmenting into other categories. This clustering of high-MoM risers near ranks 1–3 suggests The Farm (Skinny Pineapple Inc) is leaning into scale plays around flagship Flower strains to consolidate share, trading depth in Flower for wider shelf dominance.
Top Selling Cannabis Brands






Data for this report comes from real-time sales reporting by participating cannabis retailers via their point-of-sale systems, which are linked up with Headset’s business intelligence software. Headset’s data is very reliable, as it comes digitally direct from our partner retailers. However, the potential does exist for misreporting in the instance of duplicates, incorrectly classified products, inaccurate entry of products into point-of-sale systems, or even simple human error at the point of purchase. Thus, there is a slight margin of error to consider. Brands listed on this page are ranked in the top twenty within the market and product category by total retail sales volume.

