Jun-2026
Sales
Trend
6-Month
Product Count
SKUs
Avg Price
YoY Sales Change
YoY Price Change
Market Insights Snapshot
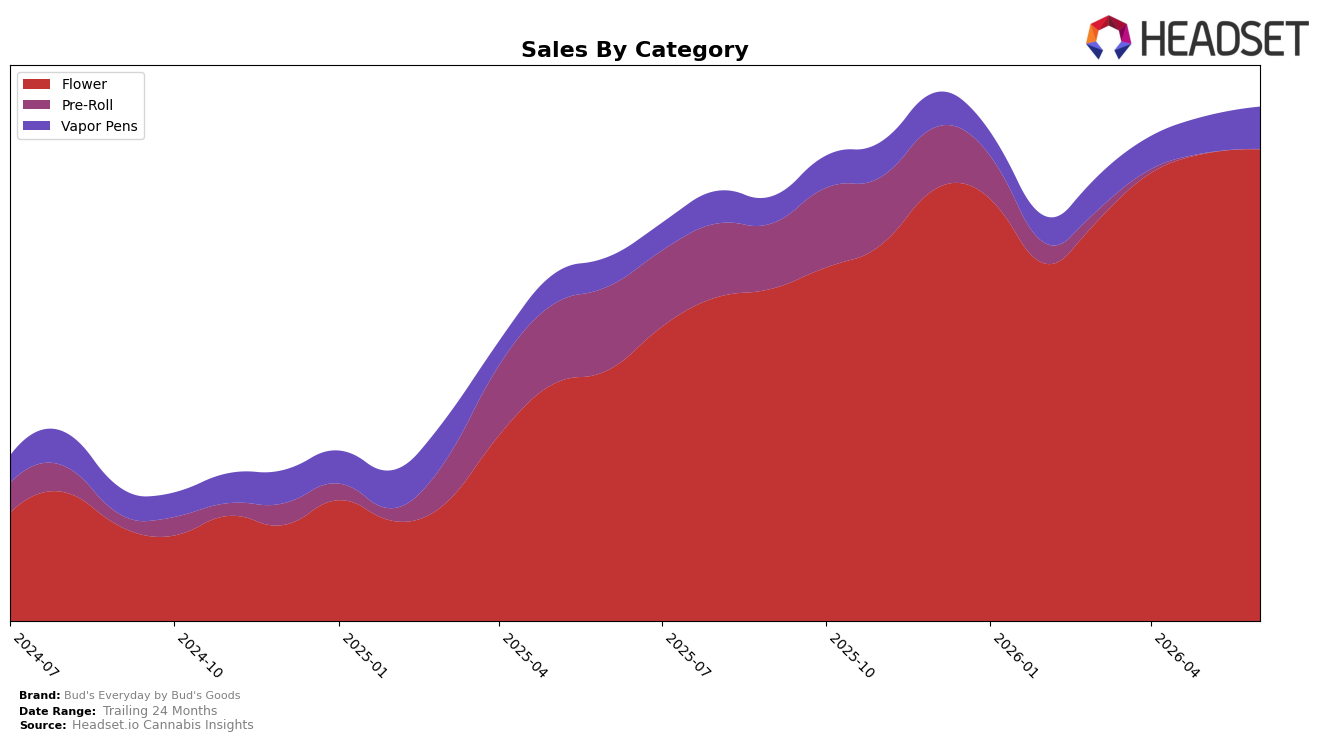
In June 2026, Bud's Everyday by Bud's Goods concentrated 88.81% of sales in Flower with year-over-year growth of 84.90% and month-over-month growth of 0.88%, while Vapor Pens held 9.47% share with 33.34% YoY and 12.38% MoM growth; Pre-Roll contracted to 1.72% share with -89.94% YoY and -2.08% MoM. Average price moved 7.50% higher YoY to $28.27, with Flower’s average price at $34.86 and Vapor Pens at $12.09, indicating a trading-up effect concentrated in the core. The pattern implies the brand is doubling down on Flower scale while using Vapor Pens as a secondary growth lever, and the sharp Pre-Roll retrenchment reallocates assortment toward higher-velocity formats.
Given a Flower rank of 7 in Massachusetts and an 88.81% category share mix, the portfolio is positioned as a Flower-first value proposition where modest 0.88% MoM growth pairs with a 84.90% YoY surge to maintain relevance at the shelf. The 12.38% MoM uptick in Vapor Pens against a smaller 9.47% share suggests the brand is testing incremental penetration without diluting the Flower anchor, while the -89.94% YoY collapse in Pre-Roll consolidates focus on formats that convert at current price points. This positioning implies the brand is trading market breadth for depth in Flower to defend rank while selectively expanding Vapor Pens to buffer against seasonal or pricing volatility.
Competitive Landscape
Bud's Everyday by Bud's Goods sits at rank #7 in Massachusetts Flower for June 2026, up 10 positions from #17 year over year, while holding steady versus March 2026 at #7; this rise to a new peak rank of #7 in June 2026 coincides with Farmer's Cut advancing from #3 to #1 and Root & Bloom moving from #16 to #5, indicating Bud's Everyday by Bud's Goods gained share despite faster upward mobility among top-tier rivals. Compared with Simply Herb, which slipped from #1 to #2 alongside a 1.6% year-over-year sales decline, Bud's Everyday by Bud's Goods improved its relative standing as High Supply / Supply climbed from #5 to #4 with 16.7% year-over-year sales growth; the pattern implies Bud's Everyday by Bud's Goods is consolidating a mid-tier foothold, using stability at #7 against mixed competitor momentum to position for incremental rank gains.

Notable Products
Blueberry Haze (14g) posted the standout move in June 2026 with a 143.8% month-over-month jump to $94,492 and seized rank 1, while Kush Cake (14g) followed with a 125.7% MoM surge at rank 2. The steepest decline came from Jay's - Papaya Pre-Roll 2-Pack (1g) at -11.1% and rank 7, and Vapor Pens held flat-to-mild shifts with Purple Punch Distillate Cartridge (1g) down 0.6% at rank 4 and Wedding Cake Distillate Cartridge (1g) up 5.9% at rank 5. Four of the top ten SKUs are Flower, including Milk & Cookies (14g) at rank 3, concentrating momentum at the top while Pre-Roll softness and mid-table Vapor Pens stability temper breadth. The pattern implies Bud's Everyday by Bud's Goods is leaning into value-ounce Flower to drive share at the expense of Pre-Roll depth, using modestly stable Vapor Pens to backfill consistency.
Top Selling Cannabis Brands
Data for this report comes from real-time sales reporting by participating cannabis retailers via their point-of-sale systems, which are linked up with Headset’s business intelligence software. Headset’s data is very reliable, as it comes digitally direct from our partner retailers. However, the potential does exist for misreporting in the instance of duplicates, incorrectly classified products, inaccurate entry of products into point-of-sale systems, or even simple human error at the point of purchase. Thus, there is a slight margin of error to consider. Brands listed on this page are ranked in the top twenty within the market and product category by total retail sales volume.

