May-2026
Sales
Trend
6-Month
Product Count
SKUs
Avg Price
YoY Sales Change
YoY Price Change
Market Insights Snapshot
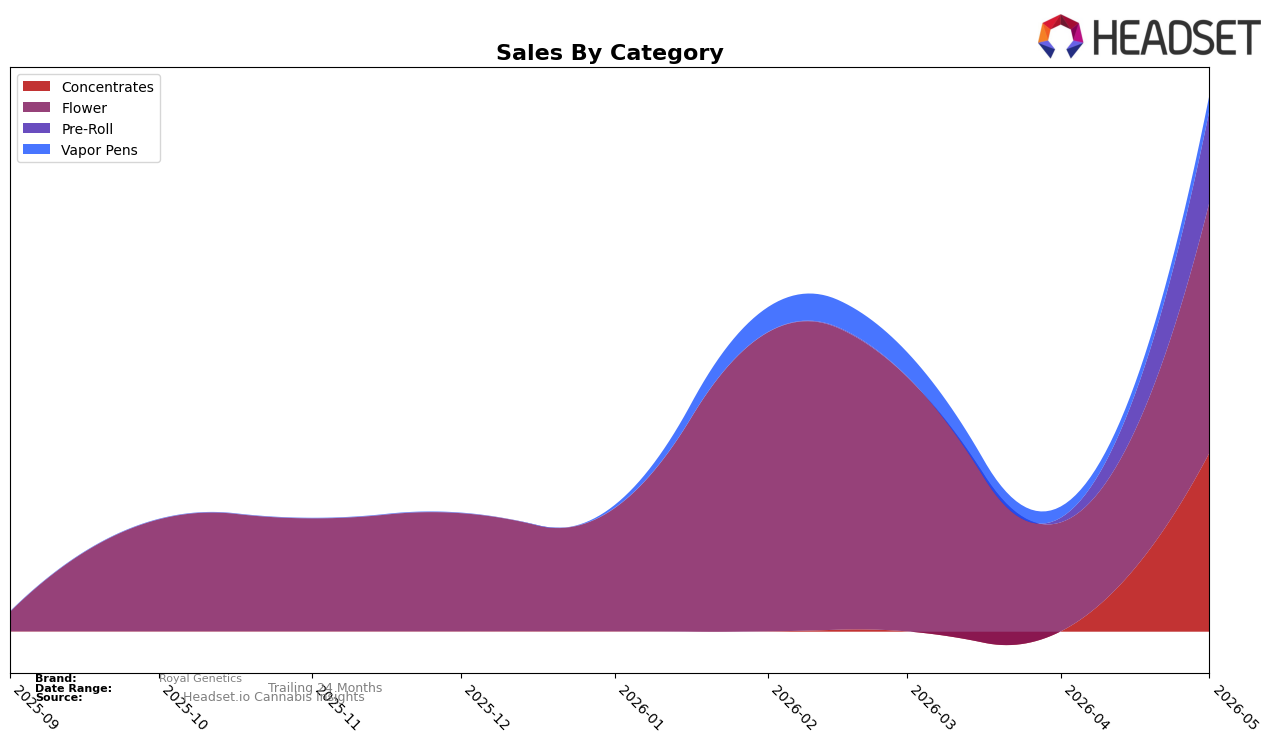
Royal Genetics concentrated its May 2026 revenue in three categories: Flower at 46.73% share and up 130.21% month over month, Pre-Roll at 17.09% share after a 1,994.33% month-over-month surge, and Concentrates at 33.34% share with no recorded month-over-month or year-over-year deltas. Vapor Pens held 2.85% share with 39.63% month-over-month growth, while the average ticket in Flower reached $47.10 and Pre-Roll sat at $14.29. The combination of a large Flower base at 46.73% alongside a step-change in Pre-Roll suggests a portfolio pivot toward higher-volume, lower-price formats, while a steady 33.34% in Concentrates indicates a maintained premium anchor; taken together, these shifts imply a reweighting toward traffic-driving SKUs without abandoning the higher-margin core.
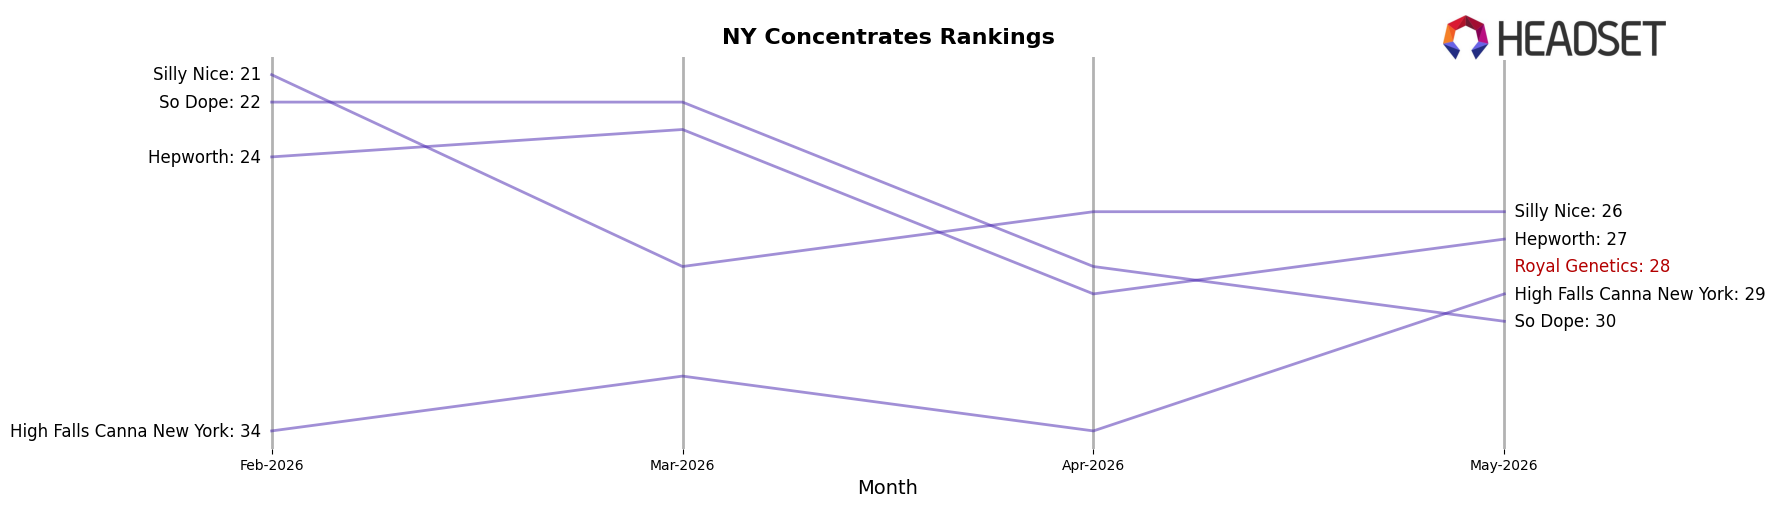
With Concentrates ranked 28th in New York in May 2026 and holding 33.34% of brand mix, the category’s role as a credibility driver is intact even as Flower’s 130.21% month-over-month lift and Pre-Roll’s 1,994.33% spike reframe where volume is coming from. Vapor Pens’ 39.63% month-over-month increase from a 2.85% base signals optionality rather than a core pillar, while category price points ranging from $14.29 in Pre-Roll to $63.79 in Concentrates establish distinct trade-up lanes. The pattern implies Royal Genetics is broadening entry points to capture incremental baskets via Flower and Pre-Roll while using Concentrates’ rank and price tier to preserve premium positioning and justify future mix-led margin balance.
Competitive Landscape
Royal Genetics sits at rank #28 in NY Concentrates in May 2026, with a YoY rank change not available and a peak rank of #28 also set in May 2026; by contrast, Mfny (Marijuana Farms New York) held #1 with a flat YoY rank at #1 and sales up 55.05%, while Jetpacks climbed from #4 to #2 with 128.63% YoY sales growth. Further up the leaderboard, RYTHM improved from #5 to #3 alongside 91.03% YoY growth, and UMAMII surged from #30 to #4 with 3,769.65% YoY sales growth, indicating that Royal Genetics’ current #28 position amid rapid upward moves from multiple rivals implies stalled competitive momentum and a widening performance gap unless rank conversion improves.
Notable Products
Super Boof Pre-Roll (1g) delivered the headline move in May 2026 with a +16,965.8% month-over-month surge to $6,485 and a jump to rank 1, while Lemon Tree Pre-Roll (1g) also spiked +8,205.3% to rank 4, signaling an abrupt shift toward inhalable convenience formats. Peanut Butter Breath Pre-Roll (1g) climbed +664.0% to rank 2 as Super Boof (3.5g) advanced +354.1% to rank 3, meaning three of the top four positions are now split between Pre-Roll and flagship Flower variants. With four of the top ten being Flower SKUs alongside three Pre-Roll entries, the mix tilts toward strain-led families spanning formats rather than isolated one-offs. This pattern implies Royal Genetics is converting strain affinity into cross-format velocity, prioritizing portfolio depth around a few breakout genetics over broad SKU proliferation.
Top Selling Cannabis Brands
Data for this report comes from real-time sales reporting by participating cannabis retailers via their point-of-sale systems, which are linked up with Headset’s business intelligence software. Headset’s data is very reliable, as it comes digitally direct from our partner retailers. However, the potential does exist for misreporting in the instance of duplicates, incorrectly classified products, inaccurate entry of products into point-of-sale systems, or even simple human error at the point of purchase. Thus, there is a slight margin of error to consider. Brands listed on this page are ranked in the top twenty within the market and product category by total retail sales volume.

