.svg)

Sep-2026
Sales
Trend
6-Month
Product Count
SKUs
Avg Price
YoY Sales Change
YoY Price Change


Where to Buy
Royal Leaf is stocked at 23 licensed dispensaries across New York, with the deepest coverage in New York, Brooklyn, Farmingdale, Queens, and Binghamton. Search by ZIP code or city below to find the closest one, or filter by product type if you are after a specific format.
Market Insights Snapshot
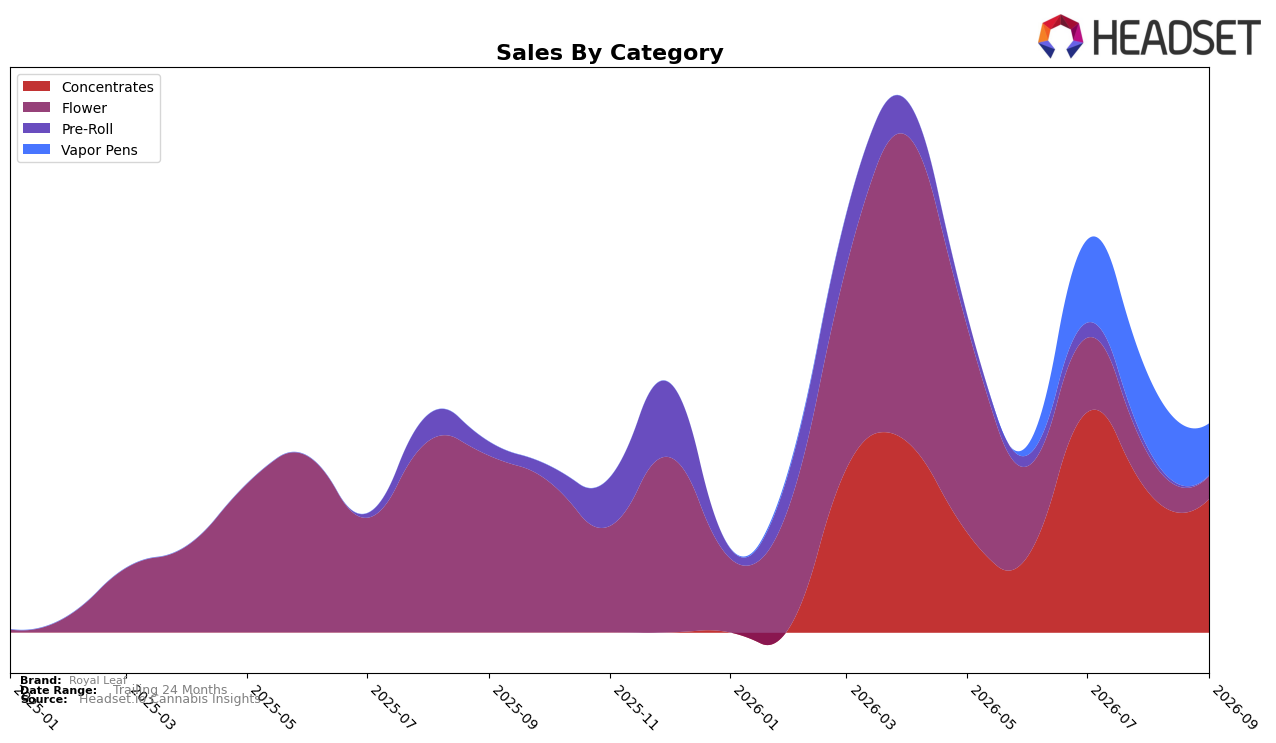
Royal Leaf’s category mix in September 2026 was concentrated in Concentrates at 64.09% share and ranked 25th in New York Concentrates, while Vapor Pens held 24.78% share and Flower 10.89% share. Month over month, Concentrates declined 4.82% and Vapor Pens fell 29.54%, with Flower dropping 39.28% and Pre-Roll contracting 90.42%, even as brand-level sales grew 9.65% year over year and average price rose 136.51% YoY to $70.62. This mix indicates a deliberate tilt toward higher-priced Concentrates (average price $99.61) as the volume-dependent segments Vapor Pens and Flower retrench, implying margin-first prioritization despite broad MoM pullbacks.
The combination of a 64.09% Concentrates share alongside a 29.54% MoM decline in Vapor Pens and an 87.14% YoY contraction in Flower suggests Royal Leaf is consolidating around a premium extract identity rather than a multi-format volume strategy. With Pre-Roll shrinking 96.24% YoY and a 25th-place rank in New York Concentrates, the brand is trading breadth for depth; the pricing step-up and category skew position it to compete on potency and specialization, but the MoM softness across three categories signals a need to reinforce repeat behavior in Concentrates to offset volatility if the premium-led path is to sustain.
Competitive Landscape
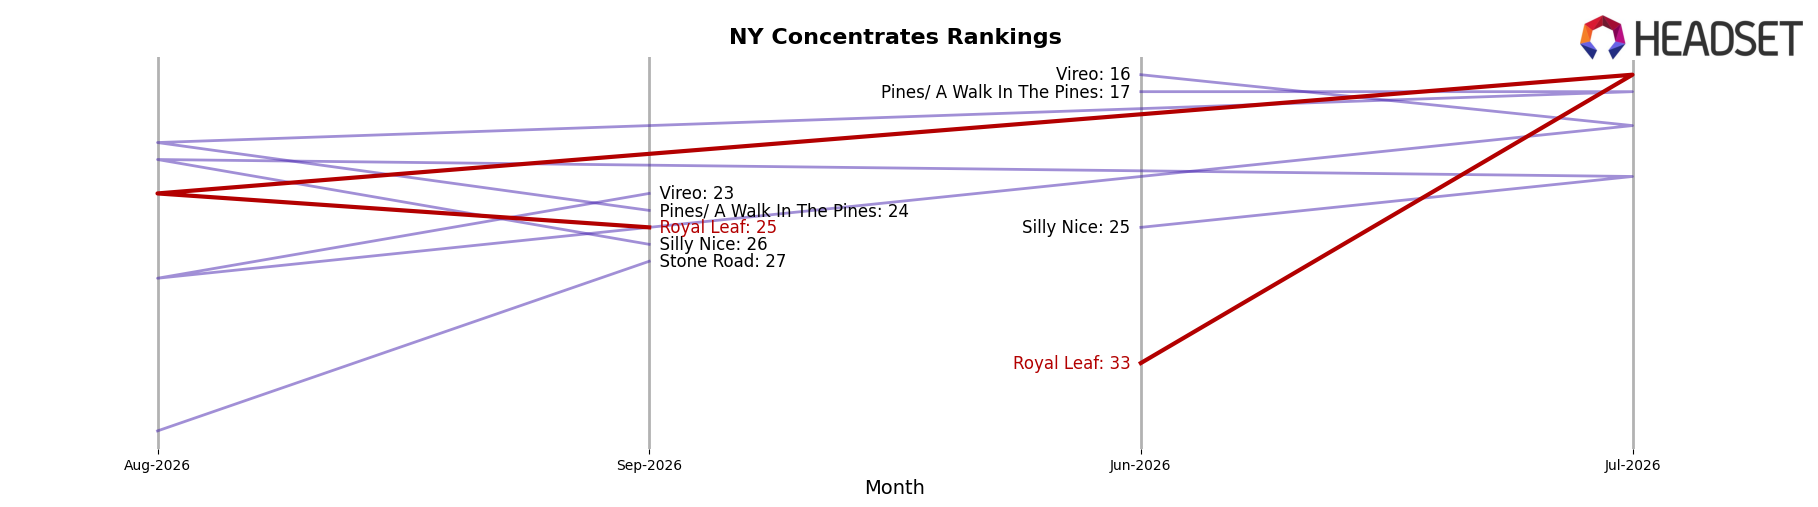
Royal Leaf sits at rank #25 in NY Concentrates in September 2026, with no year-over-year rank available, after improving 8 positions from #33 in June 2026 and retreating 9 spots from its peak at #16 in July 2026; in contrast, Mfny (Marijuana Farms New York) held #1 with a 0-position YoY change while UMAMII surged to #4 from #21 YoY alongside a 680.1% sales change. Compared with RYTHM rising to #2 from #4 YoY (+2 rank positions) and Jetpacks slipping to #3 from #2 YoY (−1 rank position), Royal Leaf’s mid-summer spike to #16 followed by a two-month slide to #25 indicates a short-lived share capture that is being outpaced by faster climbers; the trajectory implies Royal Leaf must convert July 2026 peak-period tactics into consistent execution to avoid further erosion against top-5 momentum.
Notable Products
White Chocolate Chip Cold Cured Live Rosin (2g) set the tone in September 2026 with a month-over-month surge of 192.4% to rank 1, while Cap Junky (3.5g) collapsed by 79.3% at rank 10, marking the month’s steepest decline. Vapor Pens contracted as Orange Push Pop Rosin Disposable (1g) fell 21.4% to rank 2 and Pinnacle Live Rosin Disposable (1g) dropped 39.6% to rank 4, whereas Concentrates mixed performance saw Guavaberry Live Rosin (2g) down 44.7% at rank 6 alongside the rank-1 outlier. Three of the top ten are Flower SKUs but two carry null month-over-month data and sit at ranks 5 and 7, implying the current sales engine is Concentrates with a single breakout SKU rather than a broad-based category lift. The pattern implies Royal Leaf is pivoting toward high-potency Concentrates with episodic hits, while Vapor Pens are being deprioritized or cannibalized by rosin formats.
Top Selling Cannabis Brands






Data for this report comes from real-time sales reporting by participating cannabis retailers via their point-of-sale systems, which are linked up with Headset’s business intelligence software. Headset’s data is very reliable, as it comes digitally direct from our partner retailers. However, the potential does exist for misreporting in the instance of duplicates, incorrectly classified products, inaccurate entry of products into point-of-sale systems, or even simple human error at the point of purchase. Thus, there is a slight margin of error to consider. Brands listed on this page are ranked in the top twenty within the market and product category by total retail sales volume.

