Market Insights Snapshot
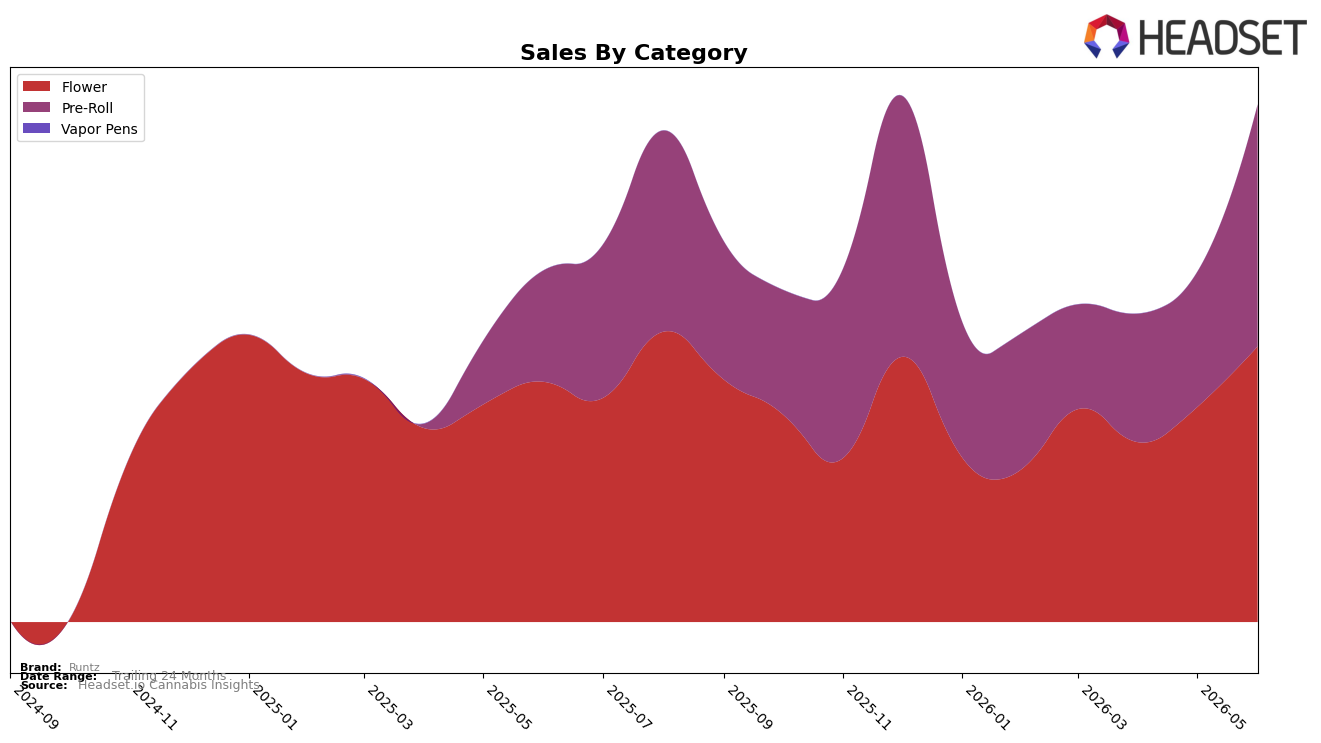
Runtz’s mix in June 2026 tilted slightly toward Flower at 53.25% share while Pre-Roll held 46.75% share, with Flower up 14.76% year over year and 28.39% month over month versus Pre-Roll up 117.14% year over year and 79.38% month over month. Average price fell 15.64% year over year to $27.03, alongside category pricing at $54.56 for Flower and $17.17 for Pre-Roll, implying that the outsized Pre-Roll growth is pulling the blended price down even as unit velocity rises; the pattern suggests a volume-led expansion anchored by Pre-Roll acceleration against steadier Flower gains.
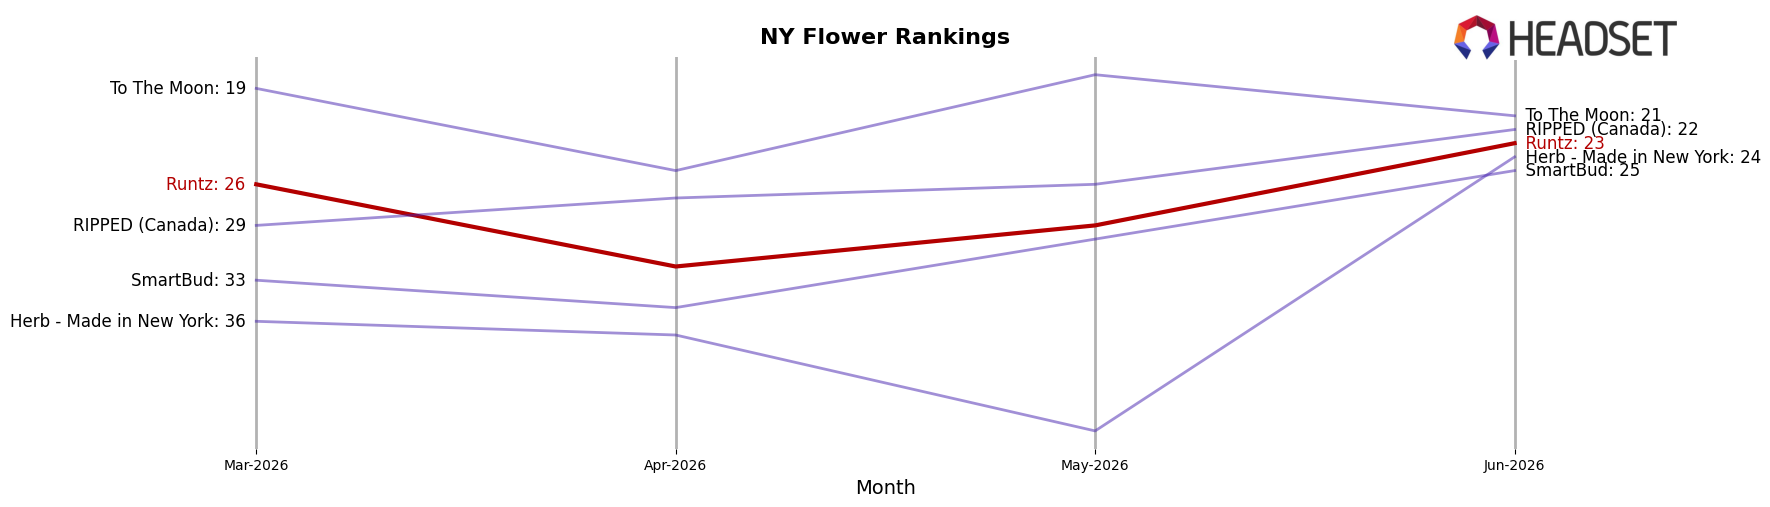
With Flower still the largest slice at 53.25% but growing far slower than Pre-Roll’s 117.14% year over year and 79.38% month over month, Runtz is migrating toward a two-pillar model where Pre-Roll increasingly carries incremental share and traffic while Flower maintains credibility in core shelves. Holding rank 23 in Flower within New York while Flower grows 28.39% month over month points to stronger near-term headroom from distribution and SKU breadth in Pre-Roll rather than a rank leap in Flower; the implication is to prioritize Pre-Roll activation to compound share gains while defending Flower positioning to avoid mix-driven margin compression.
Competitive Landscape
Runtz sits at rank #23 in New York Flower in June 2026, down 4 positions year over year from #19, and up 3 positions versus March 2026 when it was #26; its peak was #17 in January 2025, placing it 6 spots below that high today. In contrast, Find. moved up from #3 to #1 with a 35.6% year-over-year sales increase, while RYTHM advanced from #10 to #5 alongside a 40.6% sales gain, indicating rivals are converting momentum into rank more effectively than Runtz’s recent 3-position quarter-over-quarter lift. The pattern implies that Runtz’s downward YoY rank shift and distance from its January 2025 peak, amid competitors’ upward moves, points to erosion in relative velocity that will require either assortment or pricing changes to prevent further share drift.
Notable Products
White Cherry Runtz Pre-Roll 2-Pack (1.5g) posted the largest month-over-month acceleration at 253.2% to rank 3 in June 2026, while Iruntz (3.5g) fell 33.3% to rank 9, marking a split between surging pre-rolls and retreating flower. Pink Runtz Pre-Roll 2-Pack (1.5g) climbed 123.2% to rank 1 and Lemon Candy Runtz Pre-Roll 2-Pack (1.5g) rose 62.1% to rank 2, and seven of the top ten are Pre-Roll SKUs, concentrating share into a single format. Original Bubblegum Runtz Pre-Roll 2-Pack (1.5g) jumped 238.1% to rank 4 even as Obama Runtz Pre-Roll 2-Pack (1.5g) declined 17.1% to rank 5, indicating flavor-specific substitution inside the pre-roll set. The pattern implies Runtz is pivoting assortment and demand toward pre-roll multipacks at the expense of legacy flower, with June 2026 dollars consolidating in a few high-velocity SKUs rather than across formats.
Top Selling Cannabis Brands
Data for this report comes from real-time sales reporting by participating cannabis retailers via their point-of-sale systems, which are linked up with Headset’s business intelligence software. Headset’s data is very reliable, as it comes digitally direct from our partner retailers. However, the potential does exist for misreporting in the instance of duplicates, incorrectly classified products, inaccurate entry of products into point-of-sale systems, or even simple human error at the point of purchase. Thus, there is a slight margin of error to consider. Brands listed on this page are ranked in the top twenty within the market and product category by total retail sales volume.

