.svg)

Aug-2026
Sales
Trend
6-Month
Product Count
SKUs
Avg Price
YoY Sales Change
YoY Price Change


Where to Buy
Safety Meeting is stocked at 55 licensed dispensaries across Illinois, Nevada, and Oregon, 37 of them in Illinois, with the deepest coverage in Lake Zurich, Moline, Addison, Belleville, and Benton. Search by ZIP code or city below to find the closest one, or filter by product type if you are after a specific format.
Market Insights Snapshot
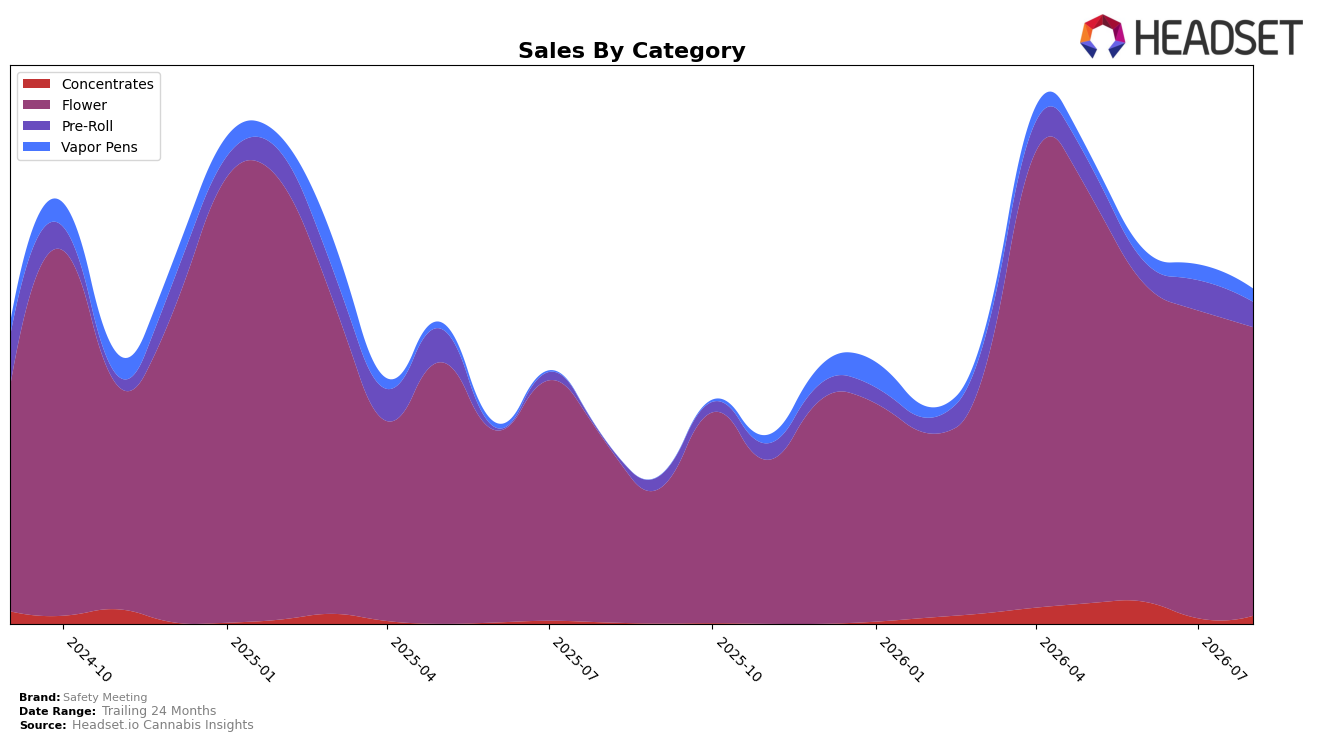
In August 2026, Safety Meeting concentrated 86.27% of sales in Flower, where year-over-year sales rose 58.55% while month-over-month slipped 6.23%, indicating depth but also recent cooling. Pre-Roll expanded to 7.46% share with a 1,683.10% year-over-year surge, yet month-over-month declined 16.72%, pointing to volatility after rapid distribution or sku adds. Vapor Pens held 3.86% share with a 16.39% month-over-month decline and no year-over-year baseline, contrasting with Concentrates at 2.40% share that jumped 44.15% month-over-month and 435.00% year-over-year. With brand-level sales up 80.89% year-over-year alongside a 40.39% drop in average price to $25.80, the pattern implies volume-led gains concentrated in Flower while smaller formats are swinging sharply and could be leveraged to stabilize monthly cadence.
The mix shift implies Safety Meeting is anchored in Flower but is testing a two-pronged ladder: Pre-Roll as a reach and trial engine and Concentrates as a premium-adjacent upsell, with August 2026 volatility (-16.72% MoM in Pre-Roll versus +44.15% MoM in Concentrates) signaling different elasticity and promotional sensitivity. The 6.23% month-over-month contraction in Flower against a 58.55% year-over-year lift suggests saturation risk at current price tiers, while the 1,683.10% year-over-year expansion in Pre-Roll and 435.00% in Concentrates indicate whitespace where incremental share could offset Flower cyclicality. Ranking at 43 in Flower within Nevada frames an opportunity: deepen distribution and price-pack architecture in Pre-Roll to convert trial into repeat while using Concentrates’ positive month-over-month to ladder shoppers upward, implying a positioning pivot from single-category dependency toward a barbell mix that balances volume resilience with margin-accretive formats.
Competitive Landscape
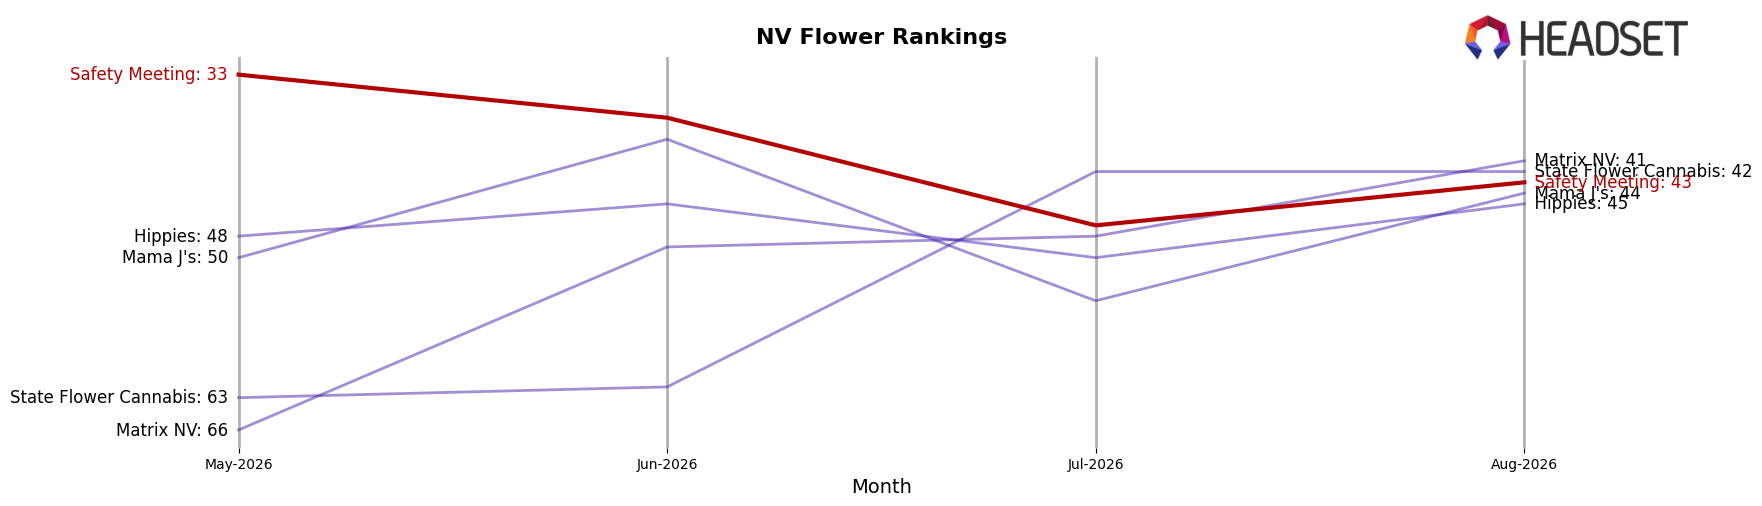
Safety Meeting sits at rank #43 in NV Flower for August 2026, improving 6 places year over year from #49 while falling 10 places since May 2026 when it was #33; against its historical ceiling of #22 in January 2025, the current position represents a 21-rank gap that has widened quarter-over-quarter. Competitive pressure is intensifying at the top: STIIIZY climbed from #2 to #1 with 50.5% year-over-year sales growth, while Neon Moon surged from #13 to #3 alongside 159.5% growth, indicating upward mobility that outpaces Safety Meeting’s 6-rank YoY gain. With RYTHM sliding from #1 to #2 (+4.3% YoY sales) and Redwood rising from #23 to #5 (+218.1% YoY sales), the dispersion at the top suggests rank volatility that favors faster growers; the trajectory implies Safety Meeting must convert its modest YoY rank lift into sustained monthly gains or risk drifting further from its January 2025 peak.
Notable Products
Wifi #43 Mixed Buds (7g) delivered the single most dramatic move in August 2026, jumping 268.7% month over month to rank 4 while Trop Cherry Pre-Roll (1g) rose 105.5% to rank 1, signaling a split surge led by both value flower and a flagship pre-roll. At the same time, Wifi 43 Pre-Roll (1g) fell 54.1% month over month at rank 10 as Bio-Jesus (7g) advanced 31.8% at rank 6, and five of the top ten SKUs are Flower formats that cluster between ranks 3 and 9. The coexistence of a triple-digit flower gain and a halved pre-roll implies shoppers are trading into larger-format flower for value while concentrating spend on a single leading pre-roll rather than the broader pre-roll lineup. This mix points to a commercial direction tilted toward bulk Flower as the volume engine, with a narrower pre-roll portfolio anchored by one or two high-velocity SKUs.
Top Selling Cannabis Brands






Data for this report comes from real-time sales reporting by participating cannabis retailers via their point-of-sale systems, which are linked up with Headset’s business intelligence software. Headset’s data is very reliable, as it comes digitally direct from our partner retailers. However, the potential does exist for misreporting in the instance of duplicates, incorrectly classified products, inaccurate entry of products into point-of-sale systems, or even simple human error at the point of purchase. Thus, there is a slight margin of error to consider. Brands listed on this page are ranked in the top twenty within the market and product category by total retail sales volume.

