Jun-2026
Sales
Trend
6-Month
Product Count
SKUs
Avg Price
YoY Sales Change
YoY Price Change
Market Insights Snapshot
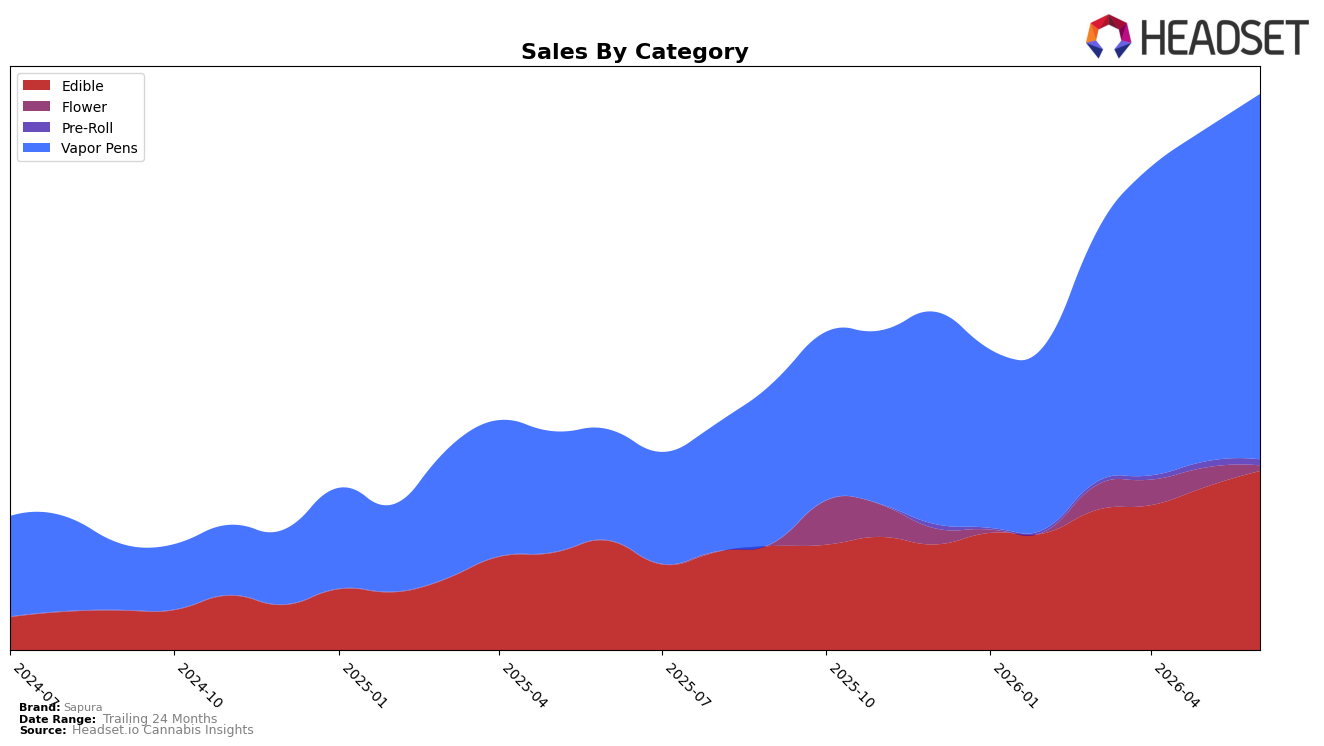
In June 2026, Sapura concentrated 65.81% of sales in Vapor Pens with a 230.30% year-over-year lift and a 10.01% month-over-month increase, while Edible held 32.21% share with 64.15% year-over-year growth and a 10.06% month-over-month gain. Pre-Roll remained a minor 1.02% share with a -2.06% month-over-month decline and no year-over-year read, and Flower slipped to 0.96% share with a -72.46% month-over-month drop and no year-over-year read. With overall brand sales up 152.87% year over year and average price up 4.58%, the mix tilt toward Vapor Pens implies a demand-led expansion rather than discount-driven volume, concentrating growth where price points are higher.
These shifts position Sapura as a Vapor Pens-first player ranked 12 in Vapor Pens in Massachusetts, pairing a 10.01% month-over-month gain in its lead category with a 10.06% month-over-month lift in Edible to create a two-pillar portfolio while de-emphasizing Flower after a -72.46% month-over-month contraction. The 230.30% year-over-year surge in Vapor Pens alongside a 64.15% year-over-year rise in Edible suggests resource allocation should prioritize cartridges and complementary ingestibles, because marginal categories at 1.98% combined share contributed little to the 152.87% brand-level year-over-year growth. The pattern implies Sapura can trade on Vapor Pens price authority (average $20.86) to drive trial into Edible (average $8.78) while containing exposure to Pre-Roll and Flower volatility.
Competitive Landscape
Sapura sits at rank #12 in June 2026 after rising 26 positions year over year from #38 to #12, and it advanced 7 spots quarter over quarter from #19 in March 2026 to #12 in June 2026; in contrast, Fernway held at #1 year over year while growing sales by 56.4%, and Dime Industries climbed from #9 to #5 alongside an 82.0% sales lift, indicating Sapura’s ascent to a new peak rank (#12 in June 2026) is narrowing the mid-tier gap but still leaves a double-digit placement to close versus the entrenched leaders, which implies continued share capture depends on converting recent rank momentum into sustained top-10 penetration.

Notable Products
Outrageous Orange Gummies 20-Pack (100mg) fell 16.6% month over month to rank 3 in June 2026, while Amped Up Apple RSO Gummies 20-Pack (100mg) dropped 12.0% at rank 5, signaling a pullback in two core fruit SKUs even as Super Charged Cherry Gummies 20-Pack (100mg) rose 26.0% to hold rank 1. Poppin Pineapple RSO Gummies 20-Pack (100mg) climbed 29.2% at rank 4 and Sour Amped Up Apple RSO Gummies 20-Pack (100mg) jumped 33.0% at rank 7, yet Blazing Blue Raspberry Gummies 20-Pack (100mg) was nearly flat at +2.0% while ranking 2. Eight of the top ten are Edible SKUs, and the two Vapor Pens entrants sit at ranks 8 and 10, concentrating dollars in gummies despite the Orange Soda Distillate Cartridge (1g) carrying $37,947 in June 2026 sales. The pattern implies Sapura’s commercial direction is tilting further toward gummies with selective flavor winners, while vape remains a secondary channel that could hedge category risk if gummy softness broadens.
Top Selling Cannabis Brands
Data for this report comes from real-time sales reporting by participating cannabis retailers via their point-of-sale systems, which are linked up with Headset’s business intelligence software. Headset’s data is very reliable, as it comes digitally direct from our partner retailers. However, the potential does exist for misreporting in the instance of duplicates, incorrectly classified products, inaccurate entry of products into point-of-sale systems, or even simple human error at the point of purchase. Thus, there is a slight margin of error to consider. Brands listed on this page are ranked in the top twenty within the market and product category by total retail sales volume.

