Jun-2026
Sales
Trend
6-Month
Product Count
SKUs
Avg Price
YoY Sales Change
YoY Price Change
Market Insights Snapshot
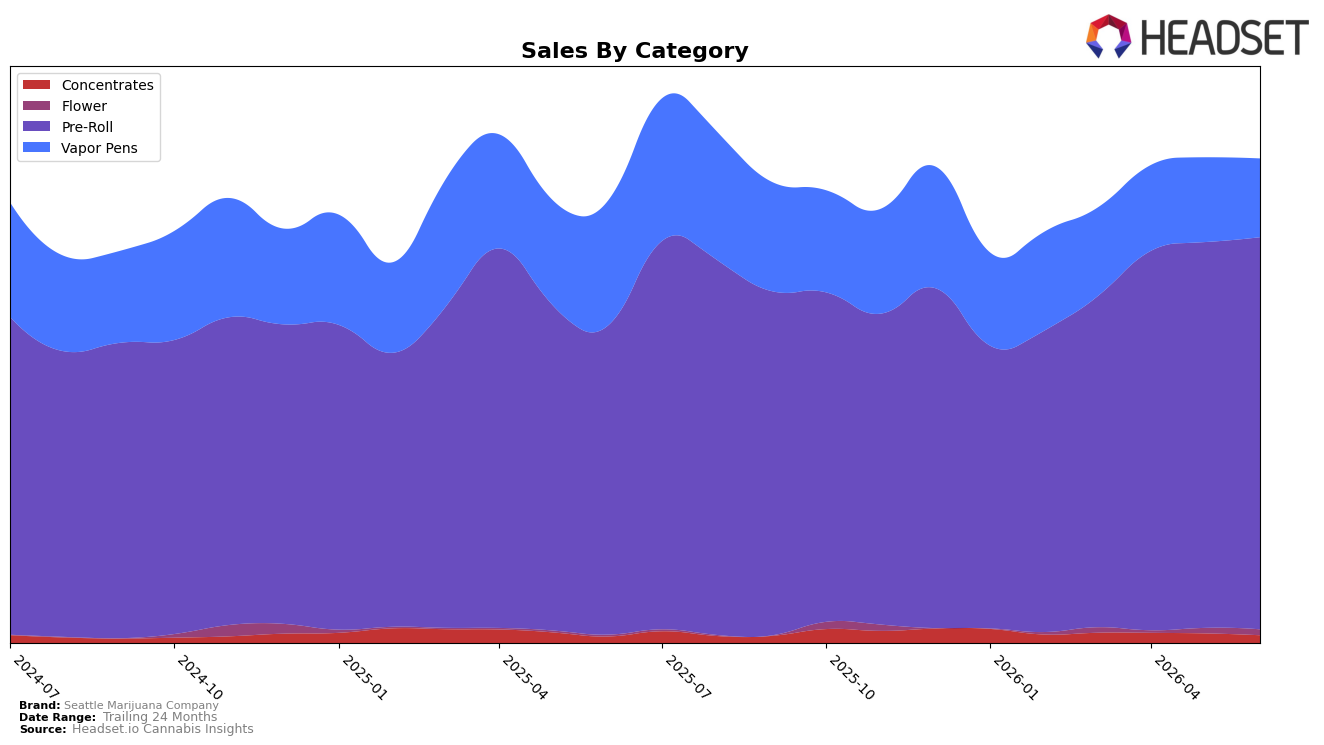
Seattle Marijuana Company concentrated 81.02% of June 2026 sales in Pre-Roll, up 1.64% month over month with a 26.81% year-over-year increase, while Vapor Pens fell to 16.24% share with a 7.12% MoM decline and a 37.04% YoY drop. Smaller lines moved unevenly: Concentrates held 1.56% share with a 19.74% MoM decline but 19.64% YoY growth, and Flower reached 1.18% share with 7.96% MoM and 247.24% YoY gains. With Pre-Roll as the top category and a Washington Pre-Roll rank of 21, the mix now skews more heavily toward lower-priced Pre-Rolls (average $9.94) as Vapor Pens (average $24.78) contract, implying deliberate emphasis on volume segments over premium cartridges.
The shift toward Pre-Rolls alongside a 3.52% YoY decline in average price and 9.49% YoY brand sales growth indicates a price-access play anchored in value velocity rather than high-ticket basket building. Elevated YoY expansion in Flower at 247.24% and sustained Pre-Roll growth at 26.81%, contrasted with Vapor Pens’ 37.04% YoY contraction and Concentrates’ 19.74% MoM pullback, suggests the brand’s positioning is consolidating around inhalable convenience formats where rank 21 in Washington Pre-Rolls can be leveraged for share accretion, while deemphasizing premium Vape price points to protect throughput.
Competitive Landscape
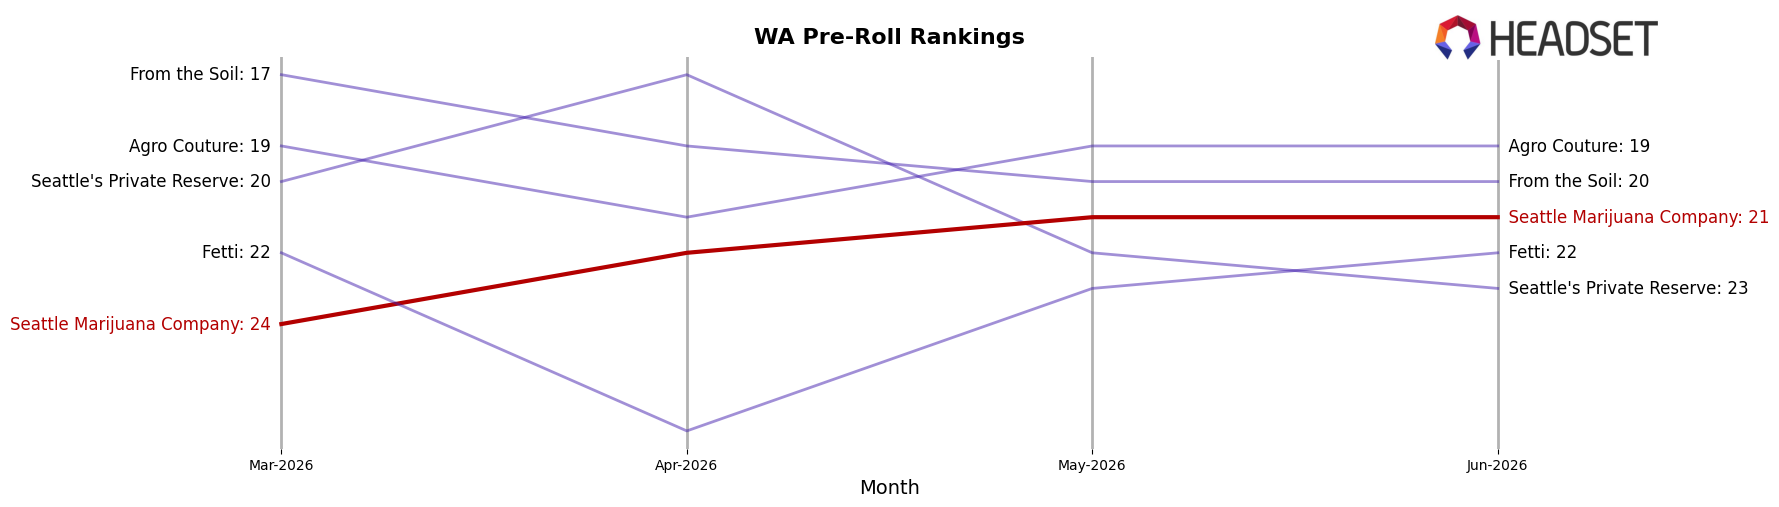
Seattle Marijuana Company sits at rank 21 in WA Pre-Roll in June 2026, improving 9 positions from rank 30 year over year, while slipping 3 spots from rank 24 in March 2026; this ties a peak rank of 21 in June 2026 and trails top movers like Ooowee, which climbed from rank 2 to rank 1 with 68.9% year-over-year sales growth, and contrasts with Phat Panda moving down from rank 1 to rank 2 despite a 1.8% year-over-year sales gain. With Lifted Cannabis Co rising from rank 6 to rank 4 alongside 16.8% growth and Stingers holding at rank 5 with 6.3% growth, the brand’s upward YoY rank change of 9 positions paired with a recent quarter-on-quarter dip of 3 suggests a trajectory of recovery that still requires share capture to convert a new peak rank into durable top-20 presence.
Notable Products
Mango Mimosa Infused Pre-Roll (1g) posted the steepest decline in June 2026 at -35.2% month over month, sliding to rank 10 from outside the top half, while category leader Cotton Candy Infused Blunt (1g) fell -19.2% yet held rank 1. In contrast, Strawberry Daiquiri Infused Pre-Roll (1g) rose 14.4% to rank 2 and Raspberry Lemonade Infused Pre-Roll (1g) advanced 25.1% to rank 8, but none exceeded the +50% threshold that would signal breakout velocity. With nine of the top ten SKUs concentrated in single-stick Pre-Rolls, the mix skews toward flavored 1g formats even as volatility widens between rank 1 at -19.2% and rank 10 at -35.2%. The pattern implies Seattle Marijuana Company is over-indexed to a narrow format where incremental flavor wins cannot offset sharp declines in lagging SKUs, pointing to a need for pack-size diversification or fewer overlapping flavors.
Top Selling Cannabis Brands
Data for this report comes from real-time sales reporting by participating cannabis retailers via their point-of-sale systems, which are linked up with Headset’s business intelligence software. Headset’s data is very reliable, as it comes digitally direct from our partner retailers. However, the potential does exist for misreporting in the instance of duplicates, incorrectly classified products, inaccurate entry of products into point-of-sale systems, or even simple human error at the point of purchase. Thus, there is a slight margin of error to consider. Brands listed on this page are ranked in the top twenty within the market and product category by total retail sales volume.

