.svg)

Aug-2026
Sales
Trend
6-Month
Product Count
SKUs
Avg Price
YoY Sales Change
YoY Price Change


Where to Buy
Seconds is stocked at 26 licensed dispensaries across Massachusetts, with the deepest coverage in Pittsfield, Boston, Fall River, Worcester, and Allston. Search by ZIP code or city below to find the closest one, or filter by product type if you are after a specific format.
Market Insights Snapshot
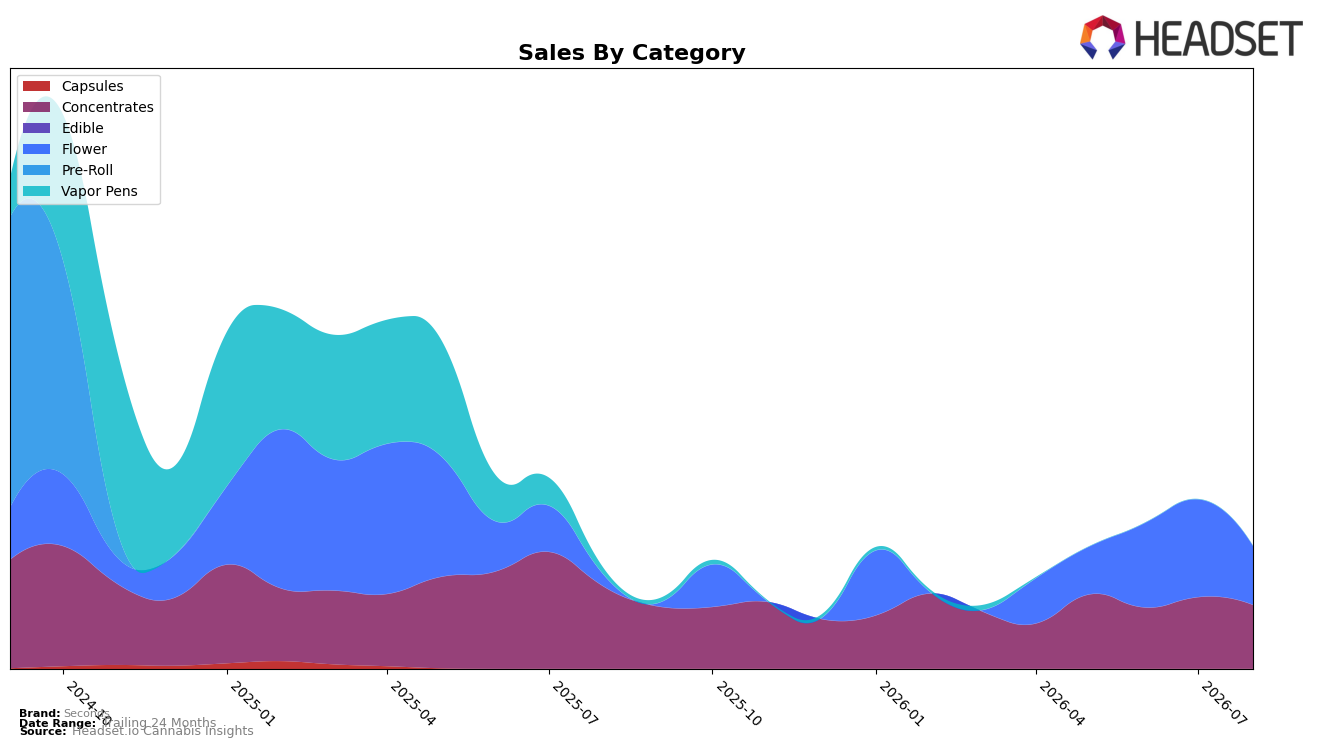
In August 2026, Seconds split its sales between Concentrates at 52.1% share and Flower at 47.9% share, but the growth vectors diverged: Concentrates declined by 22.4% year over year and 10.9% month over month, while Flower surged 431.1% year over year despite a 40.0% month-over-month pullback. The average price across the portfolio rose 27.5% year over year to $41.53, with category-level pricing skewed higher in Flower at $107.75 versus $26.52 in Concentrates. The mix shift toward higher-priced Flower, even with a sharp month-over-month dip, combined with the year-over-year contraction in Concentrates, implies a pivot away from volume-led Concentrates toward a higher ticket Flower profile that can lift revenue efficiency despite volatility.
Seconds held rank 48 in Concentrates in Massachusetts, aligning with the 22.4% year-over-year and 10.9% month-over-month declines in that category, while the 431.1% year-over-year gain in Flower rebalanced mix to nearly parity at 47.9% share. Brand-level sales grew 23.3% year over year even as 24-month sales sat 71.2% lower, indicating a rebound phase powered by premium-priced Flower offsetting Concentrates softness. This pattern implies Seconds is repositioning toward fewer, higher-priced Flower transactions to rebuild topline, accepting near-term rank pressure in Concentrates to capture margin and differentiation through pricing and mix.
Competitive Landscape
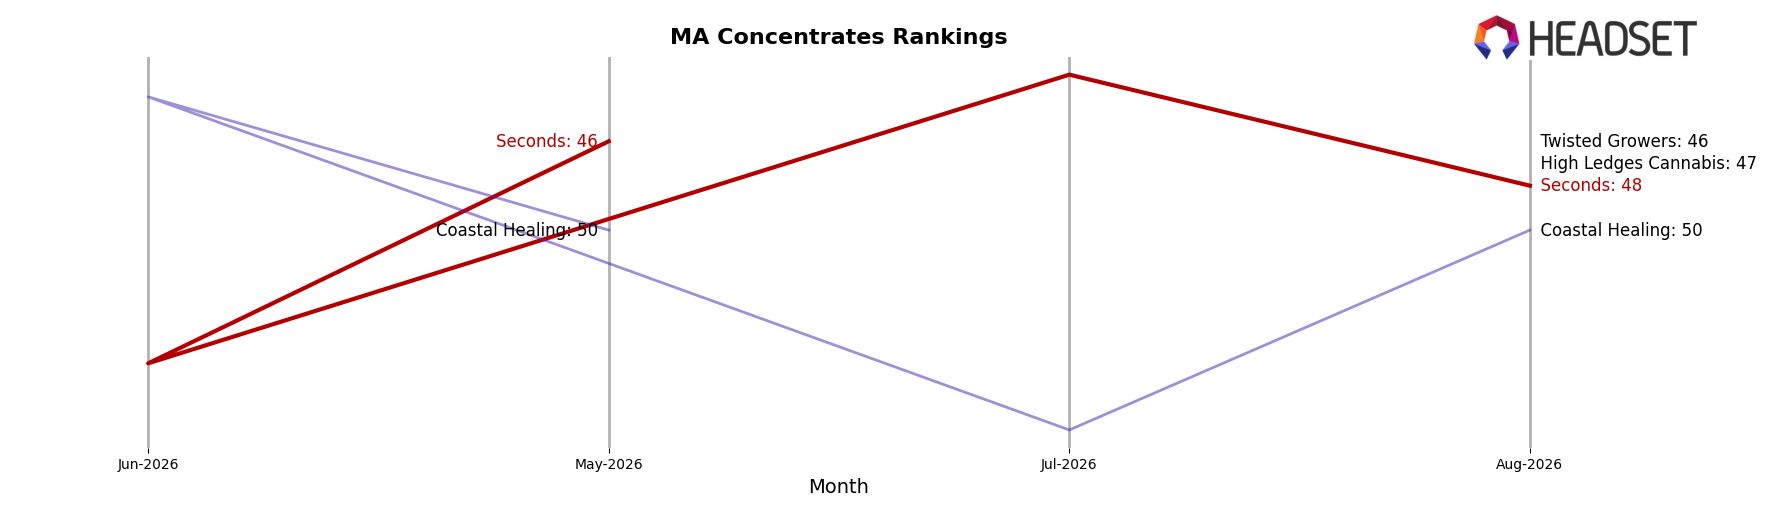
Seconds ranks #48 in Massachusetts Concentrates in August 2026, down 2 positions year over year from #46, and flat versus May 2026 where it also stood at #46; the brand remains 12 spots below its peak of #36 from July 2025, indicating slippage in competitive standing. In contrast, Good Chemistry Nurseries held #1 year over year with 61.99% sales growth, while Harbor House Collective climbed from #9 to #4 alongside a 79.87% sales increase, highlighting upward mobility among leaders as Seconds ceded two ranks. The directional spread—Seconds down 2 ranks year over year while top competitors advanced by 5 ranks or sustained #1—implies that without a shift in mix or distribution, Seconds is trending toward lower visibility within a category where gains are accruing to brands accelerating share and rank.
Notable Products
GMO Pie (28g) posted the steepest movement in August 2026 with a -39.99% month-over-month drop while sliding to rank 3, whereas Sativa RSO Dart (1g) rose 13.56% and held rank 1. Indica RSO Dart (1g) fell 36.44% to rank 2, creating a two-point spread where both RSO Darts occupy the top two ranks but move in opposite directions. With two of the top three SKUs in Concentrates, the mix tilts toward RSO-led demand concentration even as Flower weakens, implying Seconds is consolidating share around value-driven concentrates rather than large-format flower.
Top Selling Cannabis Brands






Data for this report comes from real-time sales reporting by participating cannabis retailers via their point-of-sale systems, which are linked up with Headset’s business intelligence software. Headset’s data is very reliable, as it comes digitally direct from our partner retailers. However, the potential does exist for misreporting in the instance of duplicates, incorrectly classified products, inaccurate entry of products into point-of-sale systems, or even simple human error at the point of purchase. Thus, there is a slight margin of error to consider. Brands listed on this page are ranked in the top twenty within the market and product category by total retail sales volume.

