.svg)



Market Insights Snapshot
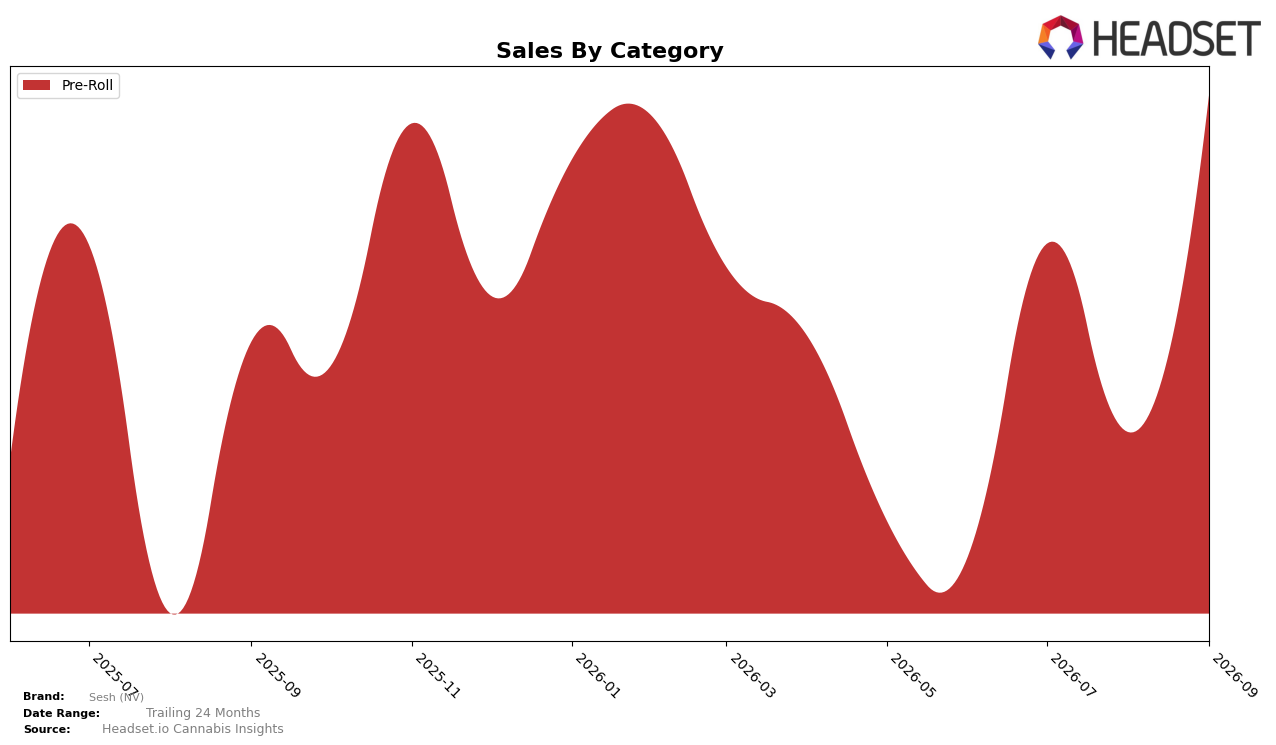
In September 2026, Sesh (NV) concentrated 100.0% of sales in Pre-Roll, with year-over-year growth of 56.06% and month-over-month acceleration of 95.98%. Average price fell 10.83% YoY to $6.94 while the Pre-Roll share remained at 100.0%, indicating volume expansion outpacing price compression. With rank 26 in Nevada Pre-Roll and a 56.06% YoY lift alongside a 95.98% MoM surge, the pattern implies the brand is trading lower unit prices for rapid unit throughput within a single-category strategy.
The consolidation into a single category at 100.0% share, paired with a 10.83% YoY price decline and a 95.98% MoM spike, suggests Sesh (NV) is leaning into value-tier price points to capture incremental basket decisions in September 2026. Sitting at rank 26 while posting 56.06% YoY growth indicates headroom: the mix concentration can sharpen positioning around high-frequency Pre-Roll missions, but without diversification, rank mobility may hinge on sustaining sub-$7 price cues and converting the MoM momentum into repeat purchases.
Competitive Landscape
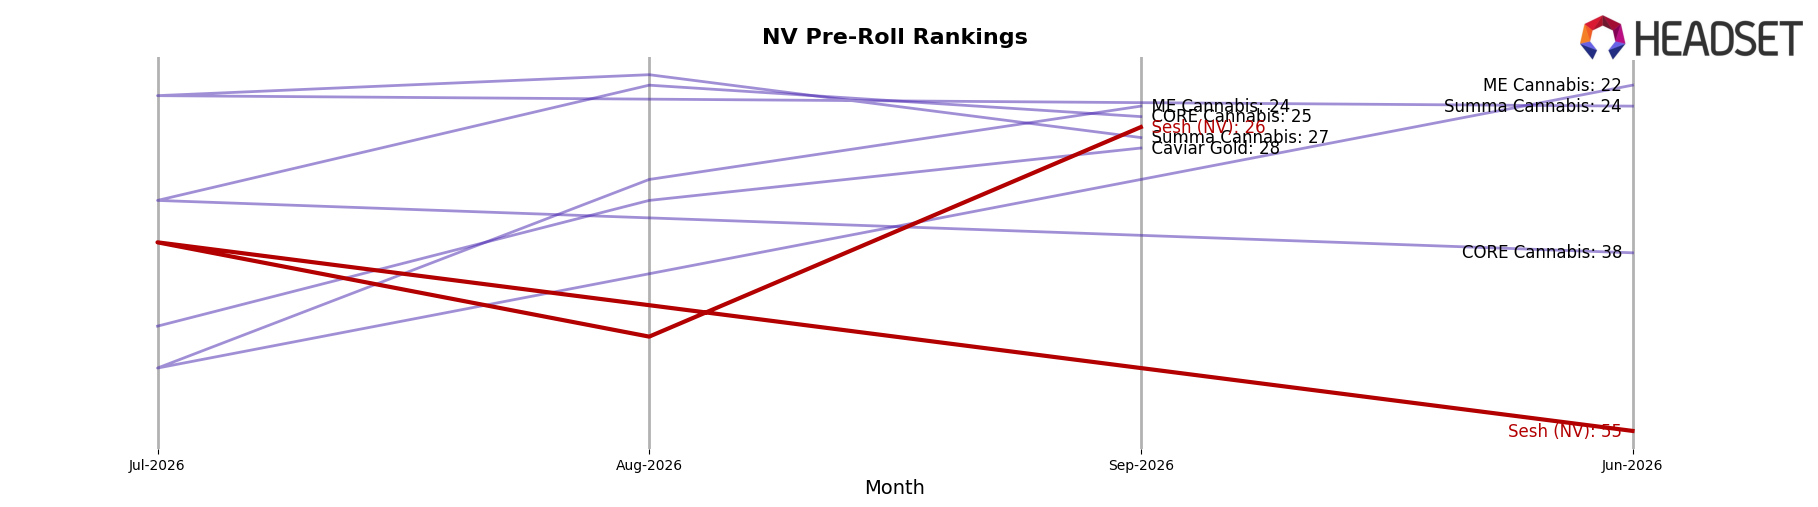
Sesh (NV) sits at rank #26 in Nevada Pre-Roll for September 2026, a 9-position climb from rank #35 in September 2025, and a 29-position rebound from rank #55 in June 2026, while still trailing its peak rank #24 from February 2026; in contrast, Rove moved from #4 to #1 with a 44.6% year-over-year sales increase, and STIIIZY slid from #1 to #2 alongside a 39.0% sales decline, indicating Sesh (NV)’s rank gains are occurring as leadership churns at the top and could sustain if momentum from June-to-September rank acceleration converts into share retention.
Notable Products
Bubblegum Gelato Pre-Roll (1g) delivered the standout move in September 2026 with a 537.8% month-over-month surge to rank 3, while Dolce De Papaya Pre-Roll (1g) fell 50.9% and Blueberry Diesel Pre-Roll (1g) declined 14.3% at rank 6, marking simultaneous acceleration and pruning within the lineup. Las Vegas Lemon Pre-Roll (1g) vaulted 388.0% to rank 1 and Lemon Butter Pre-Roll (1g) climbed 66.5% to rank 2, and five of the top six SKUs are Pre-Roll variants from fruit-forward flavor families, indicating concentration around a narrow set of terpene profiles driving velocity. With Grape Bubblegum Pre-Roll (1g) up 176.5% at rank 5 alongside the sharper pullbacks below rank 7, the mix points to a pivot toward high-churn, top-ranked flavors and de-emphasis of slower SKUs, implying Sesh (NV) will prioritize a tighter, high-rotation Pre-Roll assortment to sustain rank momentum.
Top Selling Cannabis Brands






Data for this report comes from real-time sales reporting by participating cannabis retailers via their point-of-sale systems, which are linked up with Headset’s business intelligence software. Headset’s data is very reliable, as it comes digitally direct from our partner retailers. However, the potential does exist for misreporting in the instance of duplicates, incorrectly classified products, inaccurate entry of products into point-of-sale systems, or even simple human error at the point of purchase. Thus, there is a slight margin of error to consider. Brands listed on this page are ranked in the top twenty within the market and product category by total retail sales volume.

