May-2026
Sales
Trend
6-Month
Product Count
SKUs
Avg Price
YoY Sales Change
YoY Price Change
Market Insights Snapshot
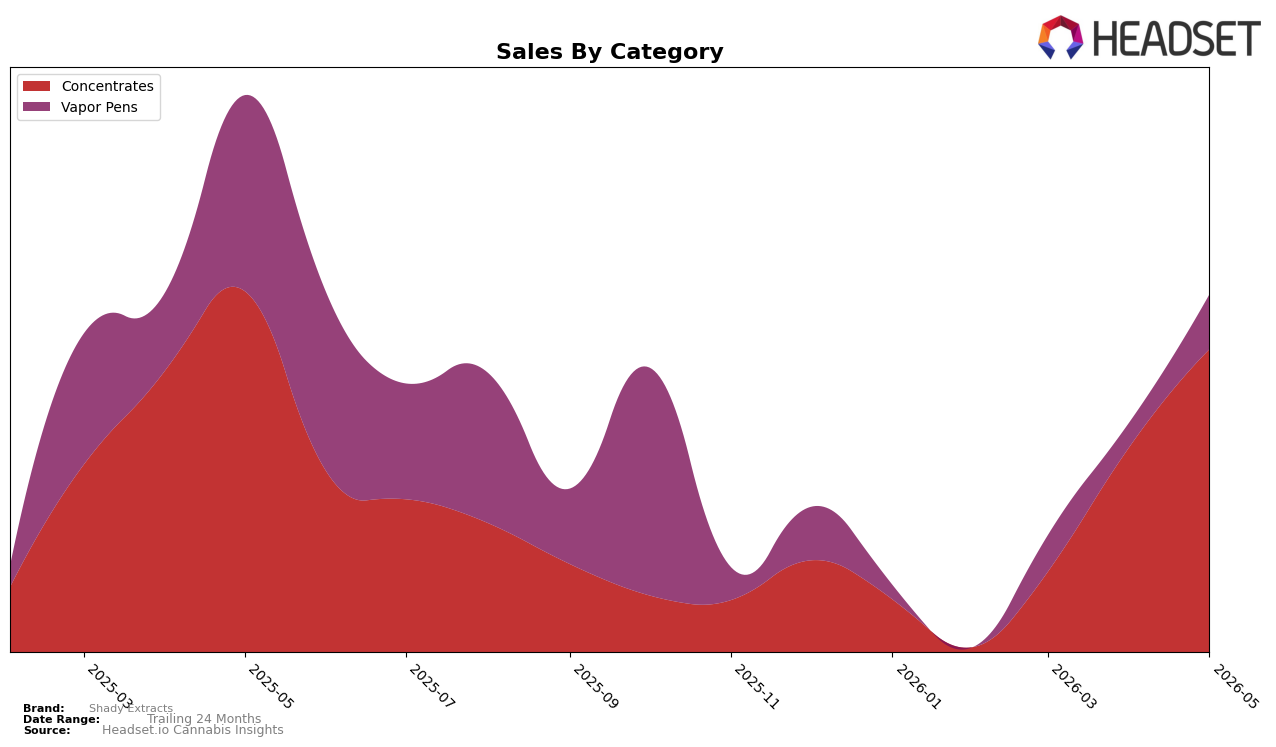
In May 2026, Shady Extracts concentrated 84.23% of sales in Concentrates and 15.77% in Vapor Pens, with Concentrates ranking 14 in New Jersey while the overall brand saw a -35.49% year-over-year sales decline and a -22.57% average price change, indicating price pressure alongside mix stability. Within categories, Concentrates declined -15.94% year over year but jumped 46.33% month over month, whereas Vapor Pens fell -71.23% year over year yet surged 111.81% month over month; with an average price near $35.75 in Concentrates and $36.23 in Vapor Pens, the month-over-month spikes suggest tactical volume recovery against a lower-price environment.
The steeper year-over-year contraction in Vapor Pens at -71.23% versus -15.94% in Concentrates, combined with the 14 rank in New Jersey Concentrates and a 46.33% month-over-month lift there, implies near-term defensibility is concentrated in the core category while diversification remains fragile. The 111.81% month-over-month rebound in Vapor Pens alongside a -22.57% brand-wide average price shift implies that recent gains likely rely on discount-led trial rather than sustained share capture, pointing to a positioning that leans into Concentrates for baseline volume while treating Vapor Pens as opportunistic and price-sensitive extensions.
Competitive Landscape
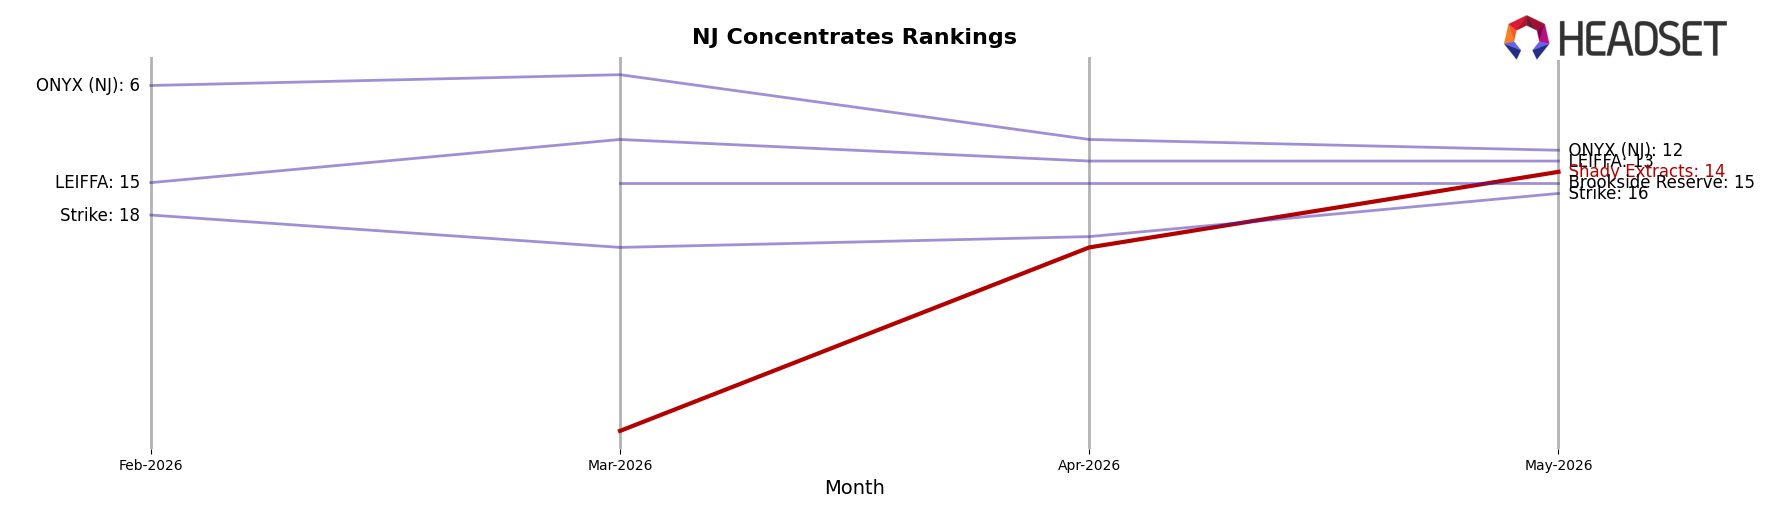
Shady Extracts sits at rank #14 in NJ Concentrates for May 2026, down 3 positions year over year from #11, while rebounding 38 spots from #52 in February 2026 to #14 in May 2026; this places the brand below its peak rank of #11 from May 2025 by 3 positions but well ahead of its three-month trough by 38 positions. In contrast, RYTHM held #1 year over year with a -3.1% sales change and remains #1 currently, and Pyramid Pens advanced from #10 to #4 alongside a 91.4% sales increase, indicating that Shady Extracts’ share of movement is lagging competitors that are consolidating top-5 positions. The pattern implies that Shady Extracts’ recent recovery in rank is momentum-driven but not yet translating into sustained top-tier placement, suggesting a need to convert volatility-driven gains into consistent top-10 presence.
Notable Products
Chimax Cured Sugar (1g) posted the single largest movement in May 2026 with +185.4% MoM, while Han Solo Burger Full Spectrum Sugar (1g) fell -27.3% yet still held rank 1, and Sour Strawberry Full Spectrum Sugar (1g) declined -19.0% at rank 2. Han Solo Burger Full Spectrum Cartridge (1g) surged +81.1% to rank 3, and Cap Junky Cured Sugar (1g) rose +55.4% around rank 7, indicating gains are concentrated in a few SKUs even as top concentrate sugars contract. With four of the top five ranks held by Concentrates and multiple cured sugars clustered around rank 7 at +31.2% to +185.4% MoM, the mix tilts toward value-seeking concentrate buyers despite one Vapor Pens SKU breaking out. This pattern implies Shady Extracts is pivoting toward breadth within Concentrates while selectively scaling a flagship cartridge to hedge category volatility, supported by roughly $11.5k on the top sugar SKU against rapid wins in mid-rank cured sugars.
Top Selling Cannabis Brands
Data for this report comes from real-time sales reporting by participating cannabis retailers via their point-of-sale systems, which are linked up with Headset’s business intelligence software. Headset’s data is very reliable, as it comes digitally direct from our partner retailers. However, the potential does exist for misreporting in the instance of duplicates, incorrectly classified products, inaccurate entry of products into point-of-sale systems, or even simple human error at the point of purchase. Thus, there is a slight margin of error to consider. Brands listed on this page are ranked in the top twenty within the market and product category by total retail sales volume.

