.svg)

Sep-2026
Sales
Trend
6-Month
Product Count
SKUs
Avg Price
YoY Sales Change
YoY Price Change



Where to Buy
Shaka is stocked at 164 licensed dispensaries across Massachusetts, New Jersey, and 4 other states, 56 of them in Massachusetts, with the deepest coverage in Worcester, Pittsfield, Boston, Greenfield, and Quincy. Search by ZIP code or city below to find the closest one, or filter by product type if you are after a specific format.
Market Insights Snapshot
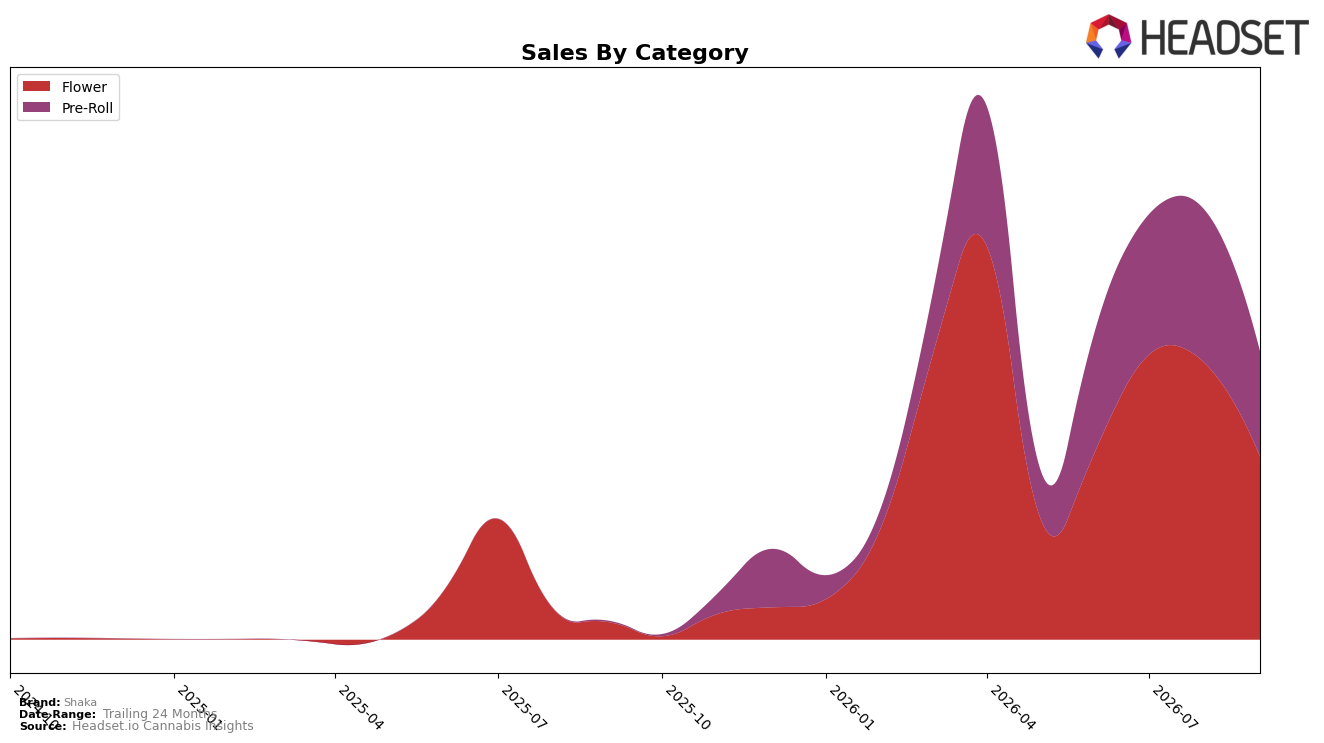
In September 2026, Shaka’s sales mix concentrated 63.54% in Flower and 36.46% in Pre-Roll, with Flower down 33.80% month over month while Pre-Roll fell 31.27% month over month. Year over year, Flower expanded 958.46% and Pre-Roll surged 9,798.87%, pushing total brand sales up 1,469.54% even as the average price declined 58.45% year over year to $15.35. Within Connecticut Flower, Shaka held rank 19, indicating mid-pack placement despite outsized category growth; this mix implies Shaka is leveraging rapid Pre-Roll scale alongside a contracting monthly base in Flower to sustain share while trading down on price.
The combination of a 36.46% Pre-Roll share and a 58.45% brand-wide price decline, alongside September month-over-month drops of 33.80% in Flower and 31.27% in Pre-Roll, indicates a volume-led, value-tier posture rather than premium positioning in Connecticut. With Flower ranked 19 and year-over-year gains of 958.46% in Flower and 9,798.87% in Pre-Roll, the brand is clustering demand in faster-turn, lower-price formats to widen reach, implying future share maintenance will depend on defending Pre-Roll velocity while stabilizing Flower rank against seasonal volatility.
Competitive Landscape
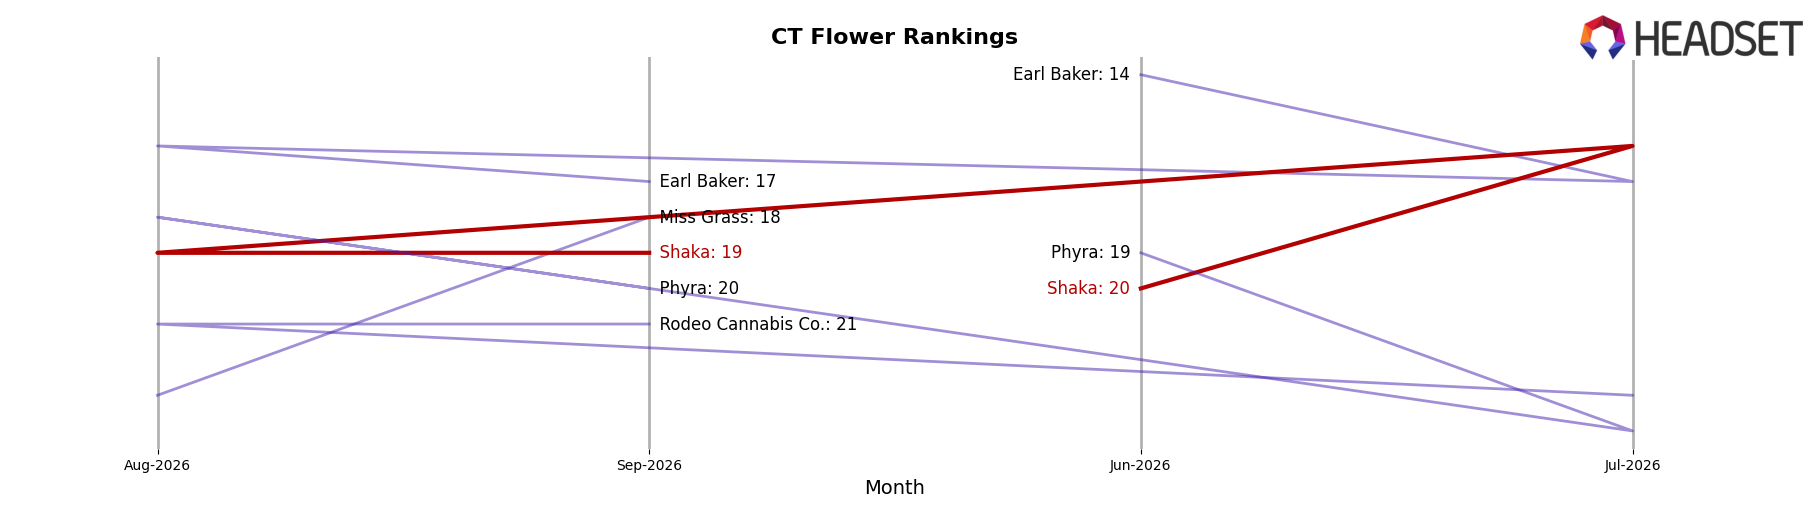
Shaka sits at rank #19 in CT Flower for September 2026, unchanged YoY from #19, while inching up 1 place from #20 three months ago; by contrast, Find. moved from #12 to #3 and expanded sales by 124.1%, and Savvy held at #2 but contracted sales by 26.8%. Shaka’s peak at #14 in July 2025 now stands 5 positions above its current spot, whereas RYTHM sits at #5 after a YoY rank move from #8 with 25.2% sales growth, and category leader Let's Burn is #1 with an unspecified YoY rank. The pattern implies Shaka’s flat YoY rank amid competitors’ divergent trajectories signals stable share retention but limited momentum, requiring either mix or pricing moves to convert slight recent improvement into a sustained climb back toward the #14 peak.
Notable Products
Animal Tsunami Pre-Roll (1g) posted the steepest decline in September 2026 at -74.43% and slid to rank 7, while Triangle Kush Pre-Roll (1g) fell -25.46% at rank 3. Delicata Cookies Pre-Roll (1g) also contracted -15.81% and held rank 2, and six of the top ten SKUs are Pre-Rolls concentrated between ranks 2 and 10. This tilt toward Pre-Rolls with double‑digit drops alongside a single Flower leader implies Shaka’s mix is overexposed to a softening format and needs broader category balance.
Banana Cake #20 (3.5g) remained the anchor at rank 1 with +8.48% MoM and approximately $43,543 in September 2026, contrasting with Frosted Truffle Pie (3.5g) at rank 6 down -41.40%. With Pre-Roll declines as deep as -72.96% at rank 9 and -43.86% at rank 8, the category’s volatility is weighing on overall momentum. The pattern indicates that sustained gains hinge on reinforcing Flower skus while pruning or repositioning weaker Pre-Roll placements.
Top Selling Cannabis Brands






Data for this report comes from real-time sales reporting by participating cannabis retailers via their point-of-sale systems, which are linked up with Headset’s business intelligence software. Headset’s data is very reliable, as it comes digitally direct from our partner retailers. However, the potential does exist for misreporting in the instance of duplicates, incorrectly classified products, inaccurate entry of products into point-of-sale systems, or even simple human error at the point of purchase. Thus, there is a slight margin of error to consider. Brands listed on this page are ranked in the top twenty within the market and product category by total retail sales volume.

