May-2026
Sales
Trend
6-Month
Product Count
SKUs
Avg Price
YoY Sales Change
YoY Price Change
Market Insights Snapshot
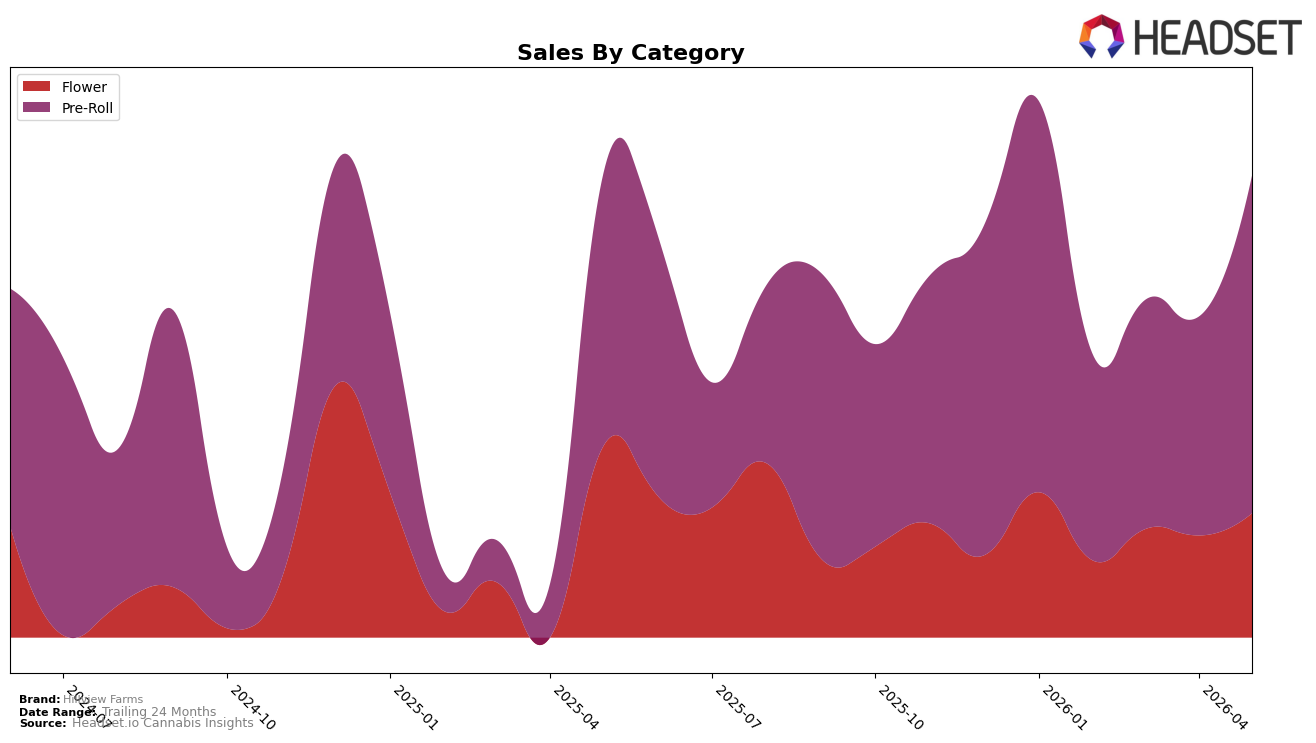
Hillview Farms concentrated 67.16% of May 2026 sales in Pre-Roll, up 39.82% month over month and 18.38% year over year, while Flower accounted for 32.84% with a 12.17% month-over-month lift but a 24.81% year-over-year decline; combined with a 36.57% year-over-year drop in average price to $20.64 and a brand-level sales change of -40.60% year over year, the mix is tilting toward lower-priced units. With Pre-Roll ranked 21 in New Jersey and average Pre-Roll price at 16.45 versus Flower at 43.08, May 2026 dynamics point to volume expansion in value-oriented formats offsetting unit revenue pressure, implying reliance on Pre-Roll momentum to stabilize share.
The acceleration of Pre-Roll share to 67.16% alongside a 39.82% month-over-month gain, versus Flower’s smaller 12.17% month-over-month rise and 24.81% year-over-year contraction, implies Hillview Farms is competing on accessible price points and quick-turn formats rather than premium tiers. Given the category rank of 21 in New Jersey and a brand-level 40.60% year-over-year sales decline paired with a 36.57% price compression, the positioning skews toward trading margin for shelf velocity, suggesting near-term share defense will depend on sustaining Pre-Roll frequency while selectively rebuilding Flower at price points closer to 16.45-to-43.08 gap economics.
Competitive Landscape
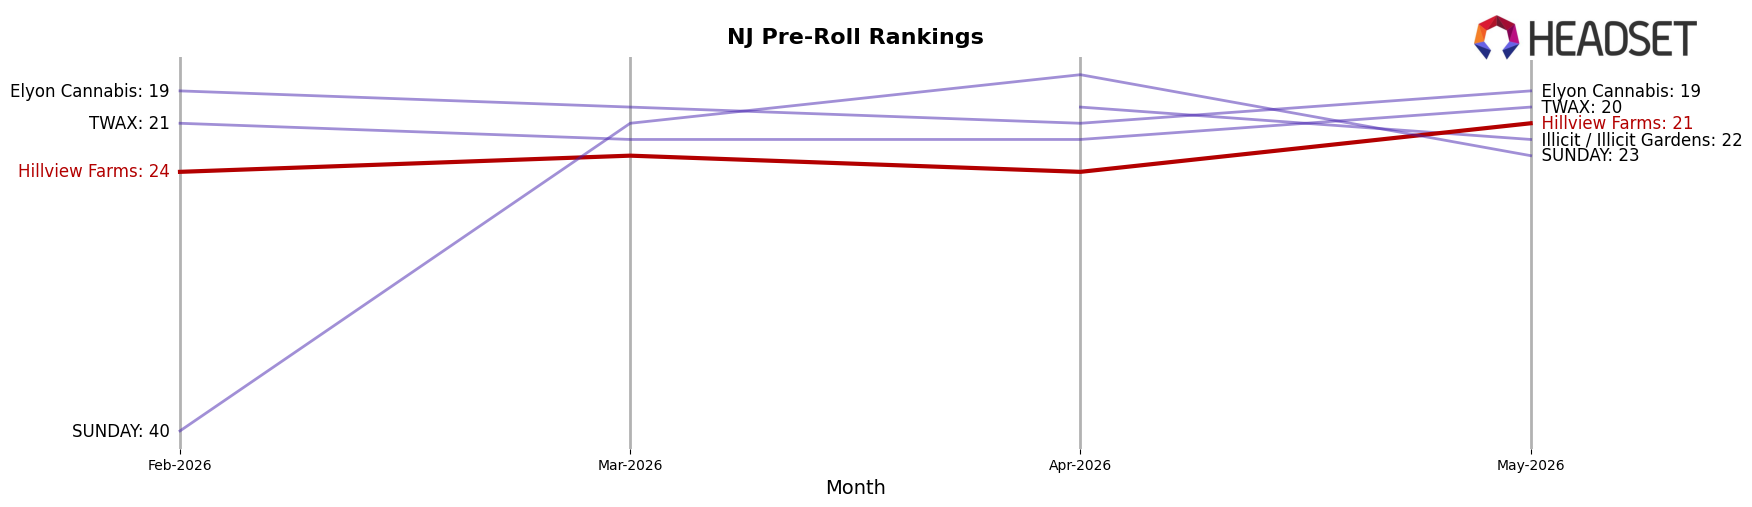
Hillview Farms sits at rank #21 in NJ Pre-Roll for May 2026, down 7 positions year over year from #14, while improving 3 spots versus February 2026’s #24, and its peak rank of #14 in May 2025 marks a 7-place slide since that high. In contrast, RYTHM held #1 after rising from #3 year over year despite a 6.2% sales decline, and Ozone climbed from #10 to #2 with 131.6% YoY sales growth, indicating competitors are consolidating share at the top as Hillview Farms loses rank share. With category leaders moving up 1–8 positions while Hillview Farms moved down 7, the pattern implies the brand’s trajectory is toward mid-pack displacement unless share recapture initiatives arrest the rank erosion.
Notable Products
Tricho Jordan Pre-Roll 2-Pack (1g) posted the standout move in May 2026 with a +92.9% month-over-month surge and reached rank 2, while Orange Sunshine Pre-Roll 2-Pack (1g) gained +72.2% MoM to hold rank 6; in contrast, Cereal Milk Pre-Roll 2-Pack (1g) rose a more moderate +44.0% MoM at rank 4. Although HiFlyer Pre-Roll 2-Pack (1g) sits at rank 1 with $5,636, five of the top six SKUs are tightly clustered within ranks 1–6, indicating momentum concentrated in a few fast-moving pre-roll variants. With all top-10 items in the Pre-Roll category and two multi-pack formats (2-Pack and 5-Pack) anchoring ranks 5 and 8, the assortment is tilting toward value-oriented pack sizes and flavor-led SKUs that can be scaled via MoM acceleration.
Top Selling Cannabis Brands
Data for this report comes from real-time sales reporting by participating cannabis retailers via their point-of-sale systems, which are linked up with Headset’s business intelligence software. Headset’s data is very reliable, as it comes digitally direct from our partner retailers. However, the potential does exist for misreporting in the instance of duplicates, incorrectly classified products, inaccurate entry of products into point-of-sale systems, or even simple human error at the point of purchase. Thus, there is a slight margin of error to consider. Brands listed on this page are ranked in the top twenty within the market and product category by total retail sales volume.

