Apr-2026
Sales
Trend
6-Month
Product Count
SKUs
Avg Price
YoY Sales Change
YoY Price Change
Market Insights Snapshot
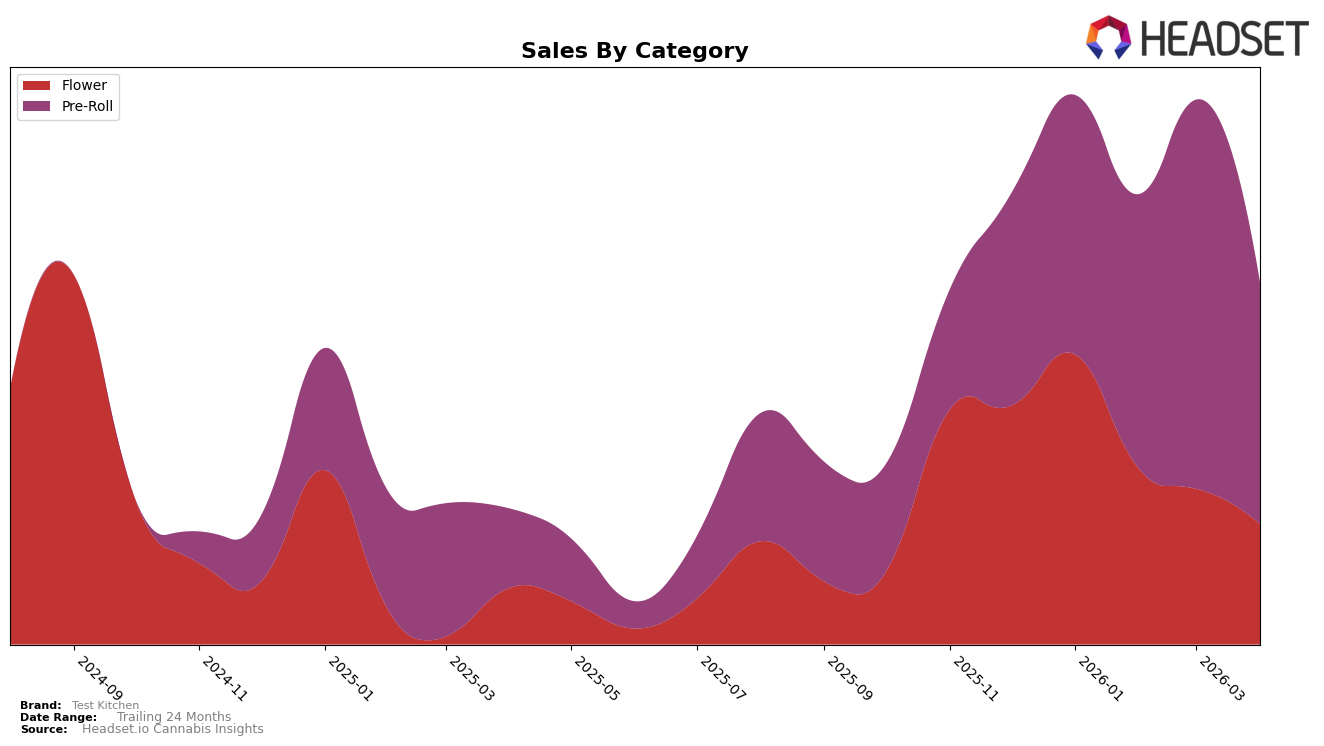
Test Kitchen has experienced varied performance across different categories and states. In the New Jersey market, the brand's Flower category has seen a decline in rankings, dropping from 46th place in January 2026 to 67th by April 2026. This downward trend in the Flower category indicates a potential challenge for Test Kitchen as they are not currently in the top 30 brands, which could be a concern for maintaining competitiveness in that segment. However, their presence in the Pre-Roll category is more promising, where they have consistently stayed in the top 30, even though they experienced a slight drop from 18th in March to 25th in April.
While the Pre-Roll category in New Jersey has shown fluctuations, it is notable that Test Kitchen's sales peaked in March 2026, indicating a strong period of performance before a decline in April. The brand's ability to maintain a relatively high rank in Pre-Rolls suggests a solid consumer base and potential for growth if they can address the challenges faced in the Flower category. The overall movement across these categories highlights the dynamic nature of the cannabis market and Test Kitchen's need to adapt to shifting consumer preferences and competitive pressures.
Competitive Landscape
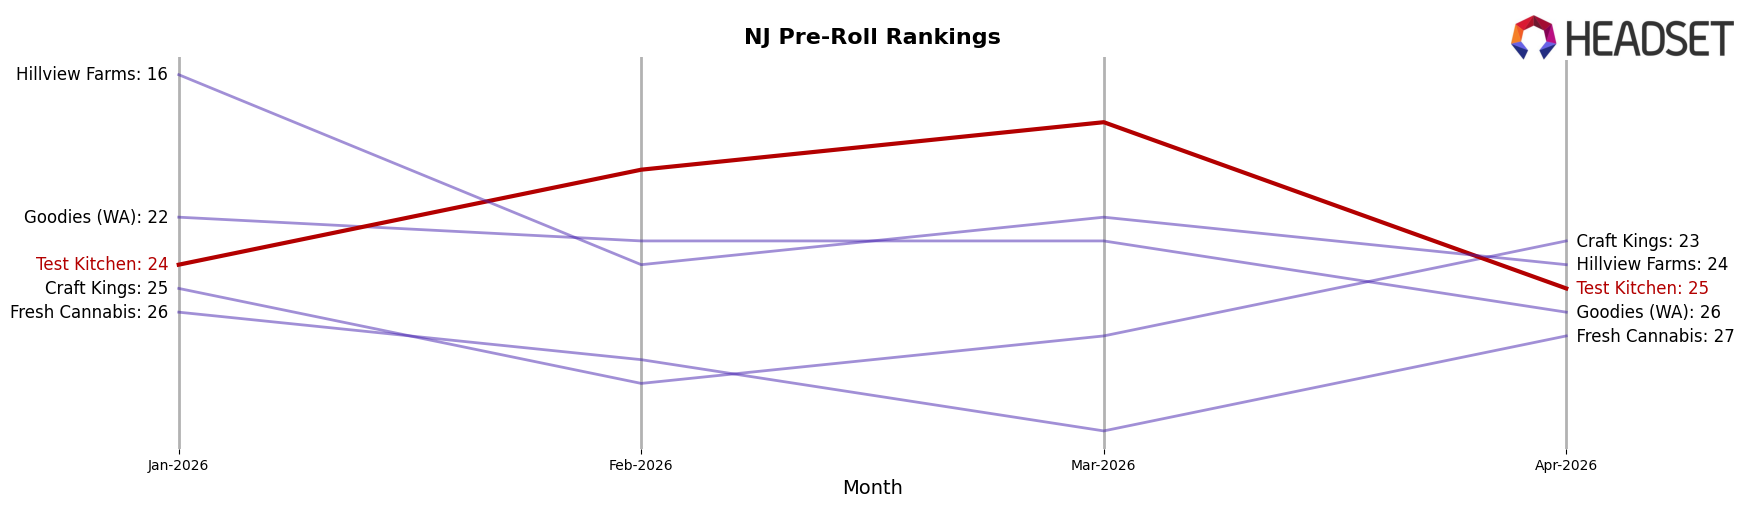
In the competitive landscape of the Pre-Roll category in New Jersey, Test Kitchen experienced notable fluctuations in its ranking and sales performance from January to April 2026. Starting at rank 24 in January, Test Kitchen improved its position to 20 in February and further to 18 in March, indicating a positive trend and increased consumer interest. However, by April, the brand slipped to rank 25, suggesting potential challenges in maintaining its competitive edge. Despite this, Test Kitchen's sales peaked in March, outperforming competitors such as Goodies (WA) and Fresh Cannabis, which did not make it to the top 20 during this period. Meanwhile, Hillview Farms and Craft Kings showed varied rankings, with Hillview Farms maintaining a relatively stable presence. Test Kitchen's ability to achieve a higher sales peak compared to its competitors highlights its potential for growth, though the drop in rank by April suggests the need for strategic adjustments to sustain its market position.
Notable Products
In April 2026, the top-performing product for Test Kitchen was Ogz x Rainbow Belts x Blue Andeeze Pre-Roll (1g), which climbed to the number one rank with sales reaching 1492 units. The A5 Pre-Roll (1g) maintained a strong position, securing the second rank, despite a decrease in sales from previous months. Fruit Stand Pre-Roll 5-Pack (2.5g) entered the rankings for the first time, achieving the third position. Tropical Treatz Pre-Roll (1g) also made its debut in the rankings, coming in at fourth place. TMX x Orange Mints Pre-Roll (1g) experienced a drop in its ranking from third in March to fifth in April, indicating a decline in sales performance.
Top Selling Cannabis Brands
Data for this report comes from real-time sales reporting by participating cannabis retailers via their point-of-sale systems, which are linked up with Headset’s business intelligence software. Headset’s data is very reliable, as it comes digitally direct from our partner retailers. However, the potential does exist for misreporting in the instance of duplicates, incorrectly classified products, inaccurate entry of products into point-of-sale systems, or even simple human error at the point of purchase. Thus, there is a slight margin of error to consider. Brands listed on this page are ranked in the top twenty within the market and product category by total retail sales volume.

