Jun-2026
Sales
Trend
6-Month
Product Count
SKUs
Avg Price
YoY Sales Change
YoY Price Change
Market Insights Snapshot
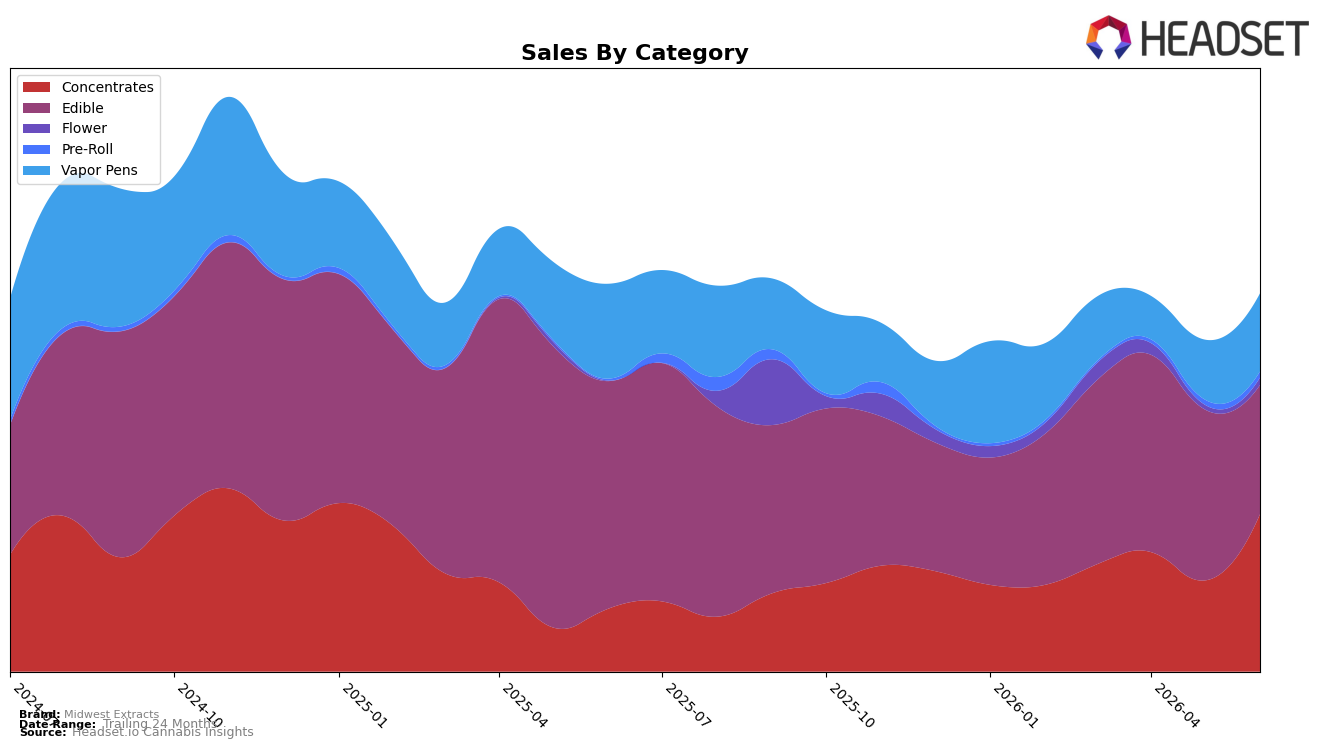
In June 2026, Concentrates expanded to 41.7% share with 72.8% MoM growth and 150.8% YoY, while Edible contracted to 34.2% share with -24.5% MoM and -43.3% YoY; Vapor Pens held 20.7% share with 30.6% MoM but -17.7% YoY, and Flower, though only 1.9% share, surged 59.3% MoM and 2,043.8% YoY. Despite brand-level sales down 2.5% YoY alongside a 34.4% YoY average price increase, the category mix skewed toward higher-growth inhalables, and Midwest Extracts’ rank at 18 in Concentrates in Michigan indicates that recent MoM momentum is concentrated where the brand is already visible, implying near-term volume is being re-anchored into Concentrates and away from Edible.
The tilt toward Concentrates (+72.8% MoM) and a rebound in Vapor Pens (+30.6% MoM) alongside a steep Edible pullback (-24.5% MoM) suggests a repositioning toward faster-turn inhalable formats, which can support higher realized price points as evidenced by the 34.4% YoY average price rise. Given the 18th rank in Concentrates in Michigan and the simultaneous share gain in small but accelerating segments like Flower (+59.3% MoM) and Pre-Roll (+20.6% MoM), the brand’s path to reversing the -2.5% YoY sales dip likely depends on consolidating its Concentrates presence while using expanding inhalable adjacencies to offset Edible attrition, implying a deliberate trade-off favoring depth in a single lead category over breadth across declining formats.
Competitive Landscape
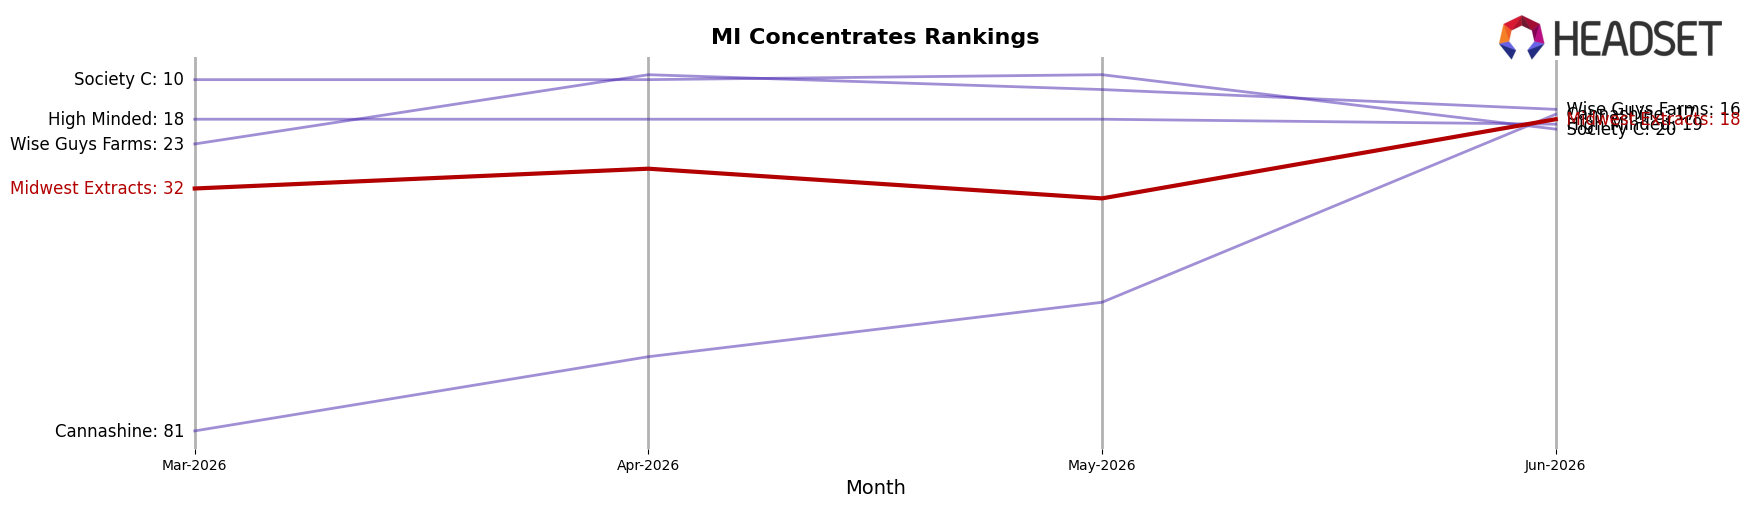
Midwest Extracts sits at rank #18 in MI Concentrates in June 2026 after climbing 28 positions from #46 year over year, but it slipped 1 spot from its peak at #17 in January 2025 and improved 14 places versus March 2026’s #32; in contrast, The Limit held #1 with a flat YoY rank at #1 while Rkive Cannabis advanced from #4 to #2 alongside a 101.3% YoY sales increase, and Uniq Pressure surged from #133 to #4 with a 3338.0% YoY sales gain. This configuration—rapid YoY ascent into the high teens but no new peak since January 2025—implies Midwest Extracts has transitioned from recovery to consolidation, with further share gains likely requiring outpacing fast risers and entrenched leaders rather than relying on base effects.
Notable Products
Yuzu Gummies 8-Pack (200mg) posted the steepest decline in June 2026 at -41.5% while holding rank 4, and Strawberry Gummies 8-Pack (200mg) fell -37.1% yet stayed at rank 1. Mango Gummies 8-Pack (200mg) slid -30.7% at rank 3, contrasted by Tutti Frutti Gummies 8-Pack (200mg) rising +43.6% at rank 6. With nine of the top ten SKUs in Edible gummies and total June sales for the number-one SKU at $14,289, concentration in a single format is high and suggests reliance on flavor rotation to defend top ranks as core fruity variants lose momentum.
Top Selling Cannabis Brands
Data for this report comes from real-time sales reporting by participating cannabis retailers via their point-of-sale systems, which are linked up with Headset’s business intelligence software. Headset’s data is very reliable, as it comes digitally direct from our partner retailers. However, the potential does exist for misreporting in the instance of duplicates, incorrectly classified products, inaccurate entry of products into point-of-sale systems, or even simple human error at the point of purchase. Thus, there is a slight margin of error to consider. Brands listed on this page are ranked in the top twenty within the market and product category by total retail sales volume.

