.svg)

Sep-2026
Sales
Trend
6-Month
Product Count
SKUs
Avg Price
YoY Sales Change
YoY Price Change


Market Insights Snapshot
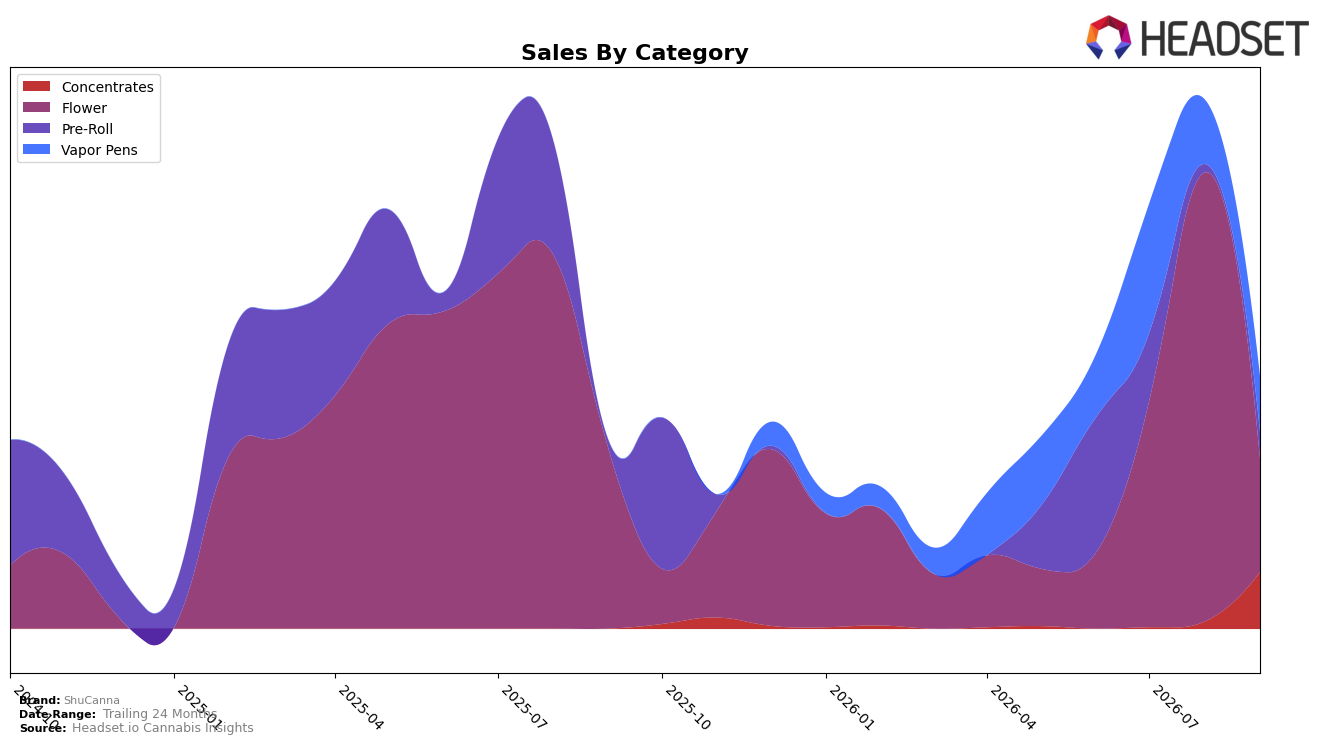
ShuCanna’s category mix in September 2026 tilted toward Flower at 44.76% share, even as Flower sales fell 37.49% year over year and 74.89% month over month, while Pre-Roll expanded to 10.74% share with a 234.42% year-over-year surge and a 233.85% month-over-month jump. Concentrates climbed to 22.52% share on a 701.57% month-over-month spike, whereas Vapor Pens held 21.98% share with a 14.07% month-over-month decline; combined with an 86th rank in Flower in British Columbia, the pattern implies a pivot away from Flower reliance toward faster-moving inhalable formats that are gaining momentum. The brand-level context of 33.65% year-over-year sales growth and a 77.40% year-over-year average price drop indicates volume-led gains concentrated in Pre-Roll and Concentrates while Flower weakens in contribution.
The shifts suggest ShuCanna is repositioning toward value-accessible inhalables, with Pre-Roll’s triple-digit growth and Concentrates’ 701.57% month-over-month lift offsetting Flower’s 37.49% year-over-year and 74.89% month-over-month declines. Given Vapor Pens’ 14.07% month-over-month contraction alongside Pre-Roll’s 233.85% month-over-month jump, the mix skew implies near-term shelf focus on low-ticket, high-velocity formats that can sustain the 33.65% year-over-year brand growth despite a 77.40% year-over-year price compression; the 86th rank in Flower in British Columbia points to reallocating emphasis from Flower toward categories where momentum and share expansion are more attainable.
Competitive Landscape
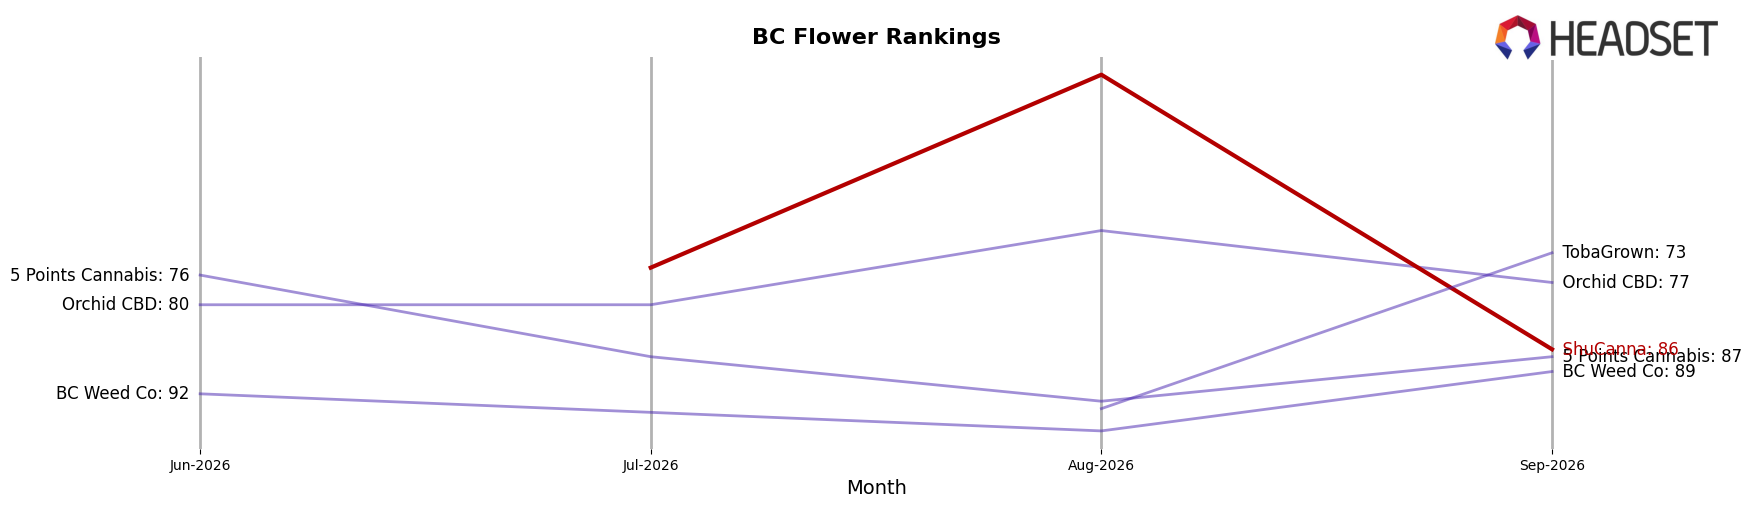
ShuCanna sits at rank #86 in BC Flower for September 2026, slipping 7 positions year over year from #79 while improving 16 places since June 2026 from #102, and it briefly peaked at #49 in August 2026 before this retracement; meanwhile, Good Supply moved up from #8 to #2 with a 59.6% YoY sales increase and Big Bag O' Buds held #1 with a 13.7% YoY lift, indicating that leaders are consolidating share as mid-pack volatility increases. The contrast between ShuCanna’s short-lived August 2026 peak at #49 and the current #86, alongside competitors holding or climbing within the top 5, implies a rank trajectory driven more by transient spikes than sustained velocity, signaling the need to stabilize distribution and repeat rates rather than chasing episodic lifts.
Notable Products
Adadab Tropical Cherry Live Resin (1g) delivered the standout move in September 2026 with a +701% month-over-month jump to rank 1, while Citrus Rock Distillate Disposable (1g) slipped 12% to rank 3. Flower contracted sharply as Citrus Rock (7g) fell 72% to rank 4 and Tropical Cherry (7g) dropped 78% to rank 5, with Tropical Cherry (14g) down 74% at rank 7, indicating wallet share shifting from bulk Flower into premium extracts. Two of the top six are Pre-Rolls, led by Shucanna Bermuda Triangle Pre-Roll 3-Pack (1.5g) at rank 2 with a null prior baseline, suggesting early traction even as the Georgia Pie Pre-Roll 3-Pack (1.5g) rose 36% at rank 6. The product mix points to a portfolio pivot toward higher-potency, smaller-format inhalables where Concentrates and Pre-Rolls can offset Flower volatility.
Top Selling Cannabis Brands






Data for this report comes from real-time sales reporting by participating cannabis retailers via their point-of-sale systems, which are linked up with Headset’s business intelligence software. Headset’s data is very reliable, as it comes digitally direct from our partner retailers. However, the potential does exist for misreporting in the instance of duplicates, incorrectly classified products, inaccurate entry of products into point-of-sale systems, or even simple human error at the point of purchase. Thus, there is a slight margin of error to consider. Brands listed on this page are ranked in the top twenty within the market and product category by total retail sales volume.

