.svg)

Sep-2026
Sales
Trend
6-Month
Product Count
SKUs
Avg Price
YoY Sales Change
YoY Price Change


Where to Buy
Sinse Cannabis is stocked at 160 licensed dispensaries across Missouri, with the deepest coverage in Kansas City, St. Louis, Springfield, Columbia, and Independence. Search by ZIP code or city below to find the closest one, or filter by product type if you are after a specific format.
Market Insights Snapshot
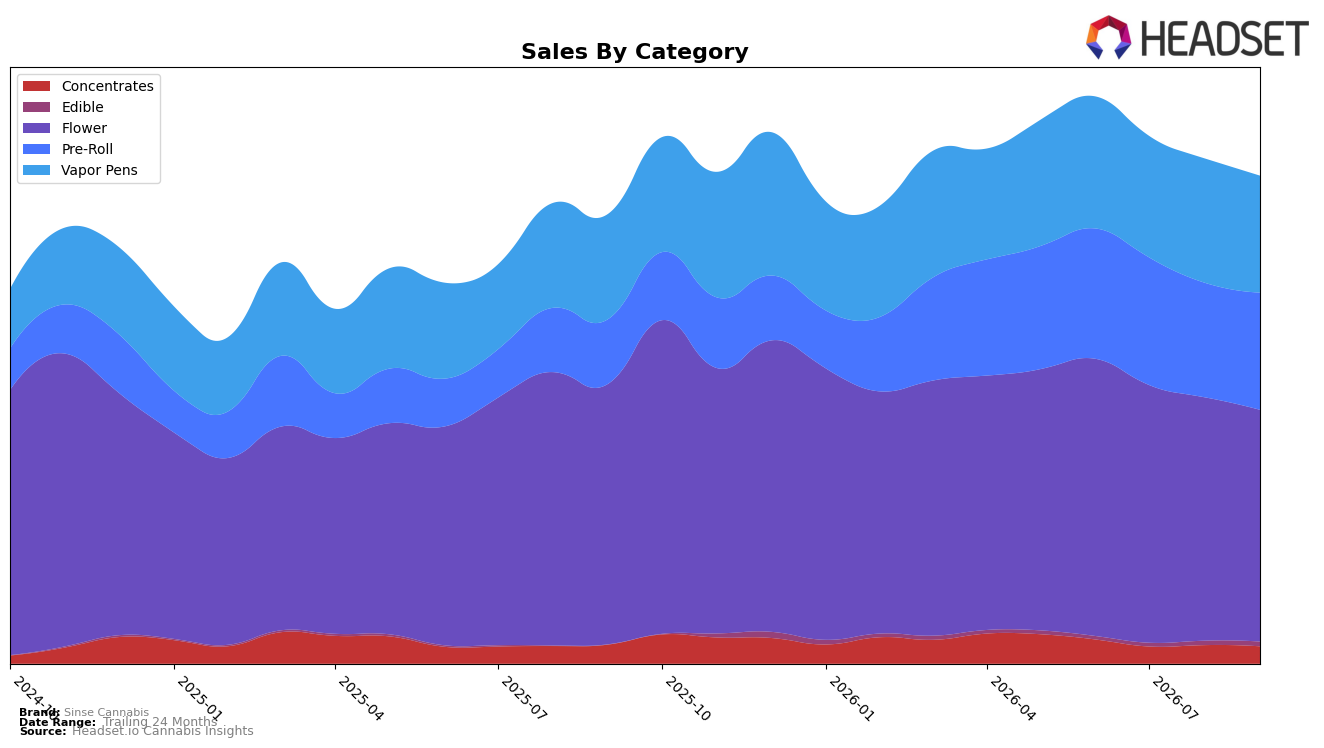
In September 2026, Sinse Cannabis concentrated 47.48% of sales in Flower while Pre-Roll and Vapor Pens each sat near one-quarter of mix at 24.02% and 23.95%, respectively; this distribution pairs with a category rank of 3 in Flower in Missouri and a brand-level year-over-year sales change of 8.47%. The mix is pivoting: Pre-Roll expanded 81.30% YoY and 2.33% MoM while Flower contracted 11.06% YoY and 4.79% MoM, and Vapor Pens grew 11.05% YoY but slipped 5.94% MoM; alongside a 1.74% share from Edible surging 1,744.14% YoY and 7.58% MoM off a small base and Concentrates declining 9.11% YoY and 6.42% MoM, the pattern implies reliance on Flower is easing as momentum shifts toward combustibles and nascent Edible trials.
These shifts point to a repositioning opportunity: with average price down 16.45% YoY to $15.02 and Flower’s average price at $10.69 against Vapor Pens at $38.49, the brand can protect margin mix by leaning into Pre-Roll’s 24.02% share and 81.30% YoY growth while managing Flower’s 4.79% MoM pullback. Maintaining a top-3 Flower rank in Missouri while Pre-Roll inches up 2.33% MoM and Vapor Pens softens 5.94% MoM implies near-term promotional elasticity favors Pre-Roll over Vape; coupled with Edible’s 7.58% MoM uptick and 0.97% share, the brand’s positioning is shifting toward accessible price points and format variety to stabilize MoM volatility without overextending into declining Concentrates (−6.42% MoM).
Competitive Landscape
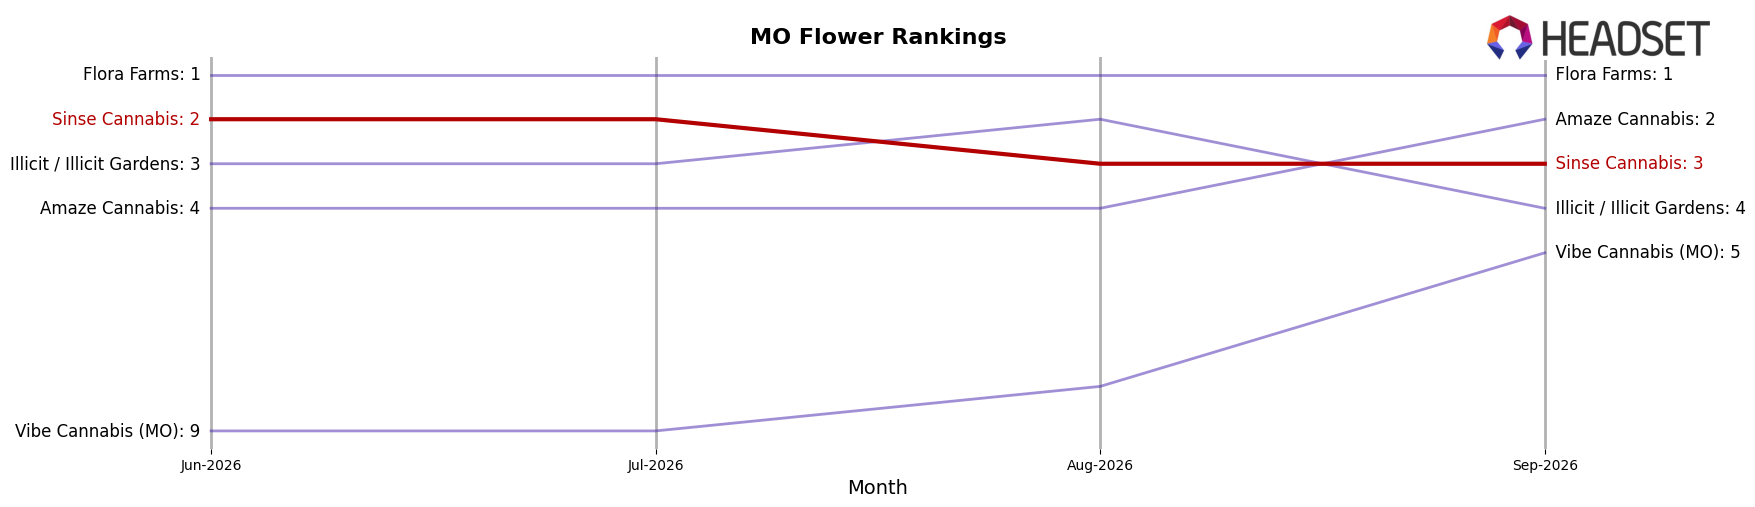
Sinse Cannabis sits at rank #3 in Missouri Flower in September 2026, unchanged year over year at #3, after slipping 1 position from #2 in June–August to #3 in September and giving back its July 2026 peak at #2; meanwhile, Flora Farms held #1 year over year and remained #1 in September while growing sales by 33.4%, and Amaze Cannabis climbed from #6 year over year to #2 in September with approximately 19.8% sales growth, placing direct upward pressure on the #3 slot. Compared with July 2026 when Sinse Cannabis reached its peak rank of #2, the brand is now one place lower while Illicit / Illicit Gardens stayed at #4 year over year with an 8.7% sales decline, indicating that the immediate share threat is above rather than below. The pattern implies that maintaining #3 is viable but regaining #2 will require countering Amaze Cannabis’s upward momentum and the stability of Flora Farms’s #1 position.
Notable Products
Scented Marker (3.5g) posted the steepest decline in September 2026 at -27.2% MoM while sliding to rank 9, as Lemon Royale (Bulk) also contracted -10.0% MoM at rank 3. In contrast, Blueberry Muffin (Bulk) rose 29.1% MoM to rank 1 and generated $236,796, but Cinderella 99 (3.5g) fell -15.0% MoM at rank 5. With eight of the top ten SKUs in Flower, the mix points to reliance on bulk and eighth formats even as volatility at ranks 3 and 9 signals tightening consumer preference within the Flower set.
Top Selling Cannabis Brands






Data for this report comes from real-time sales reporting by participating cannabis retailers via their point-of-sale systems, which are linked up with Headset’s business intelligence software. Headset’s data is very reliable, as it comes digitally direct from our partner retailers. However, the potential does exist for misreporting in the instance of duplicates, incorrectly classified products, inaccurate entry of products into point-of-sale systems, or even simple human error at the point of purchase. Thus, there is a slight margin of error to consider. Brands listed on this page are ranked in the top twenty within the market and product category by total retail sales volume.

