.svg)

Sep-2026
Sales
Trend
6-Month
Product Count
SKUs
Avg Price
YoY Sales Change
YoY Price Change


Market Insights Snapshot
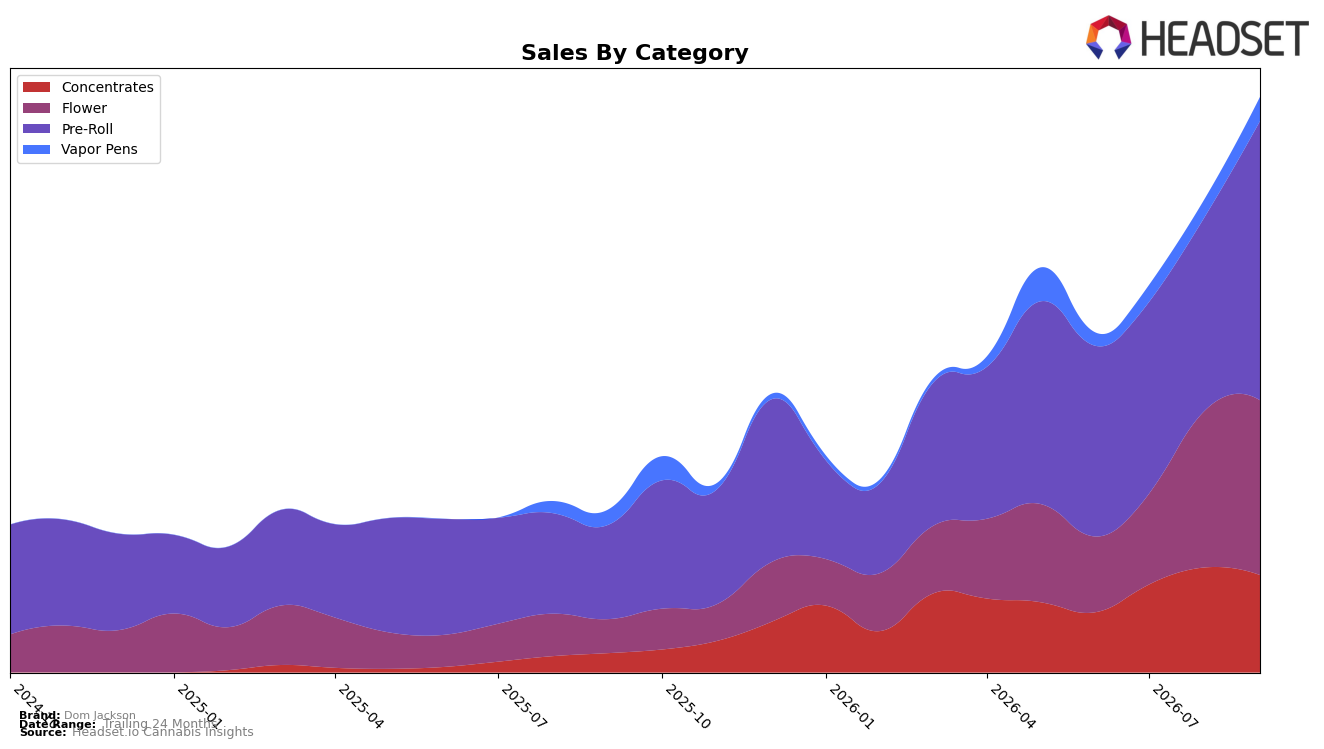
In September 2026, Dom Jackson’s mix tilted toward Pre-Roll at 48.54% share with 196.71% year-over-year growth and a 44.13% month-over-month lift, while Flower held 30.37% share with 417.24% year-over-year and 11.57% month-over-month increases; in contrast, Concentrates carried 16.93% share with 406.67% year-over-year growth but a -7.22% month-over-month decline. Vapor Pens remained a small 4.16% share yet accelerated 58.37% year-over-year and 33.73% month-over-month, alongside a brand-level average price drop of -14.48% year-over-year to $26.41. The simultaneous month-over-month surge in Pre-Roll and Vapor Pens alongside a pullback in Concentrates implies a demand shift toward easier-entry formats that benefit from price elasticity rather than potency-led niches.
With Pre-Roll designated as the top category and a provincial focus in ON, the 44.13% month-over-month gain in Pre-Roll against a 33.73% month-over-month rise in Vapor Pens suggests Dom Jackson is consolidating a convenience-forward identity while using lower average prices to expand reach. Given a Pre-Roll rank of 48 in Saskatchewan and category growth rates of 417.24% year-over-year in Flower versus 196.71% year-over-year in Pre-Roll, the brand’s positioning skews toward broad access plays where price-driven Pre-Roll and recovering Vapor Pens can scale, while Concentrates’ -7.22% month-over-month signals selective retreat from enthusiast segments.
Competitive Landscape
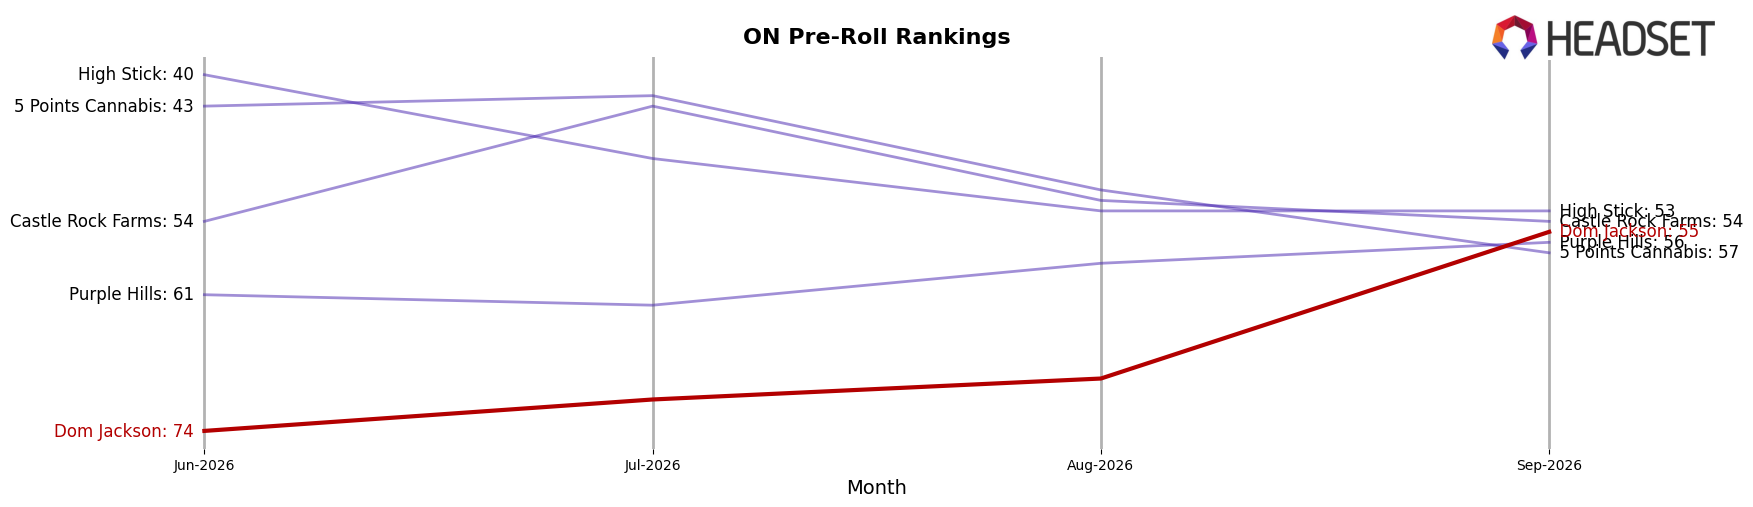
Dom Jackson sits at #55 in ON Pre-Roll in September 2026, climbing 39 positions from #94 year over year and improving 19 places from #74 in June 2026, marking a new peak at #55. Competitive movement at the top tightened: Back Forty / Back 40 Cannabis rose from #2 to #1 while growing sales 46.6%, and General Admission slipped from #1 to #2 with a 38.2% sales decline, indicating a reshuffle that favors faster climbers; meanwhile, Spinach jumped from #17 to #4 with 141.2% sales growth. The combination of Dom Jackson’s YoY rank ascent of 39 spots alongside sharpened top-tier churn implies a late-cycle catch-up dynamic where mid-pack gains are feasible, but sustaining momentum will require closing the gap versus leaders accelerating into the top 5.
Notable Products
Gas Mask Pre-Roll 10-Pack (5g) posted the standout movement in September 2026 with a +168.6% month-over-month surge and climbed to rank 4, while Dom's Dime Piece (1g) advanced to rank 1 on +68.7% MoM. In contrast, Mary-go-round (3.5g) fell to rank 8 with a -24.7% MoM decline, marking the steepest drop among the top ten. With five of the top ten SKUs in Pre-Roll, and Gas Mask Pre-Roll 3-Pack (1.5g) also up +67.8% at rank 3, the mix points to a pivot toward multi-pack Pre-Rolls as the commercial engine, with Flower playing a supporting role despite one $114,571 outlier in Pre-Roll revenue.
Top Selling Cannabis Brands






Data for this report comes from real-time sales reporting by participating cannabis retailers via their point-of-sale systems, which are linked up with Headset’s business intelligence software. Headset’s data is very reliable, as it comes digitally direct from our partner retailers. However, the potential does exist for misreporting in the instance of duplicates, incorrectly classified products, inaccurate entry of products into point-of-sale systems, or even simple human error at the point of purchase. Thus, there is a slight margin of error to consider. Brands listed on this page are ranked in the top twenty within the market and product category by total retail sales volume.

