.svg)

Sep-2026
Sales
Trend
6-Month
Product Count
SKUs
Avg Price
YoY Sales Change
YoY Price Change


Market Insights Snapshot
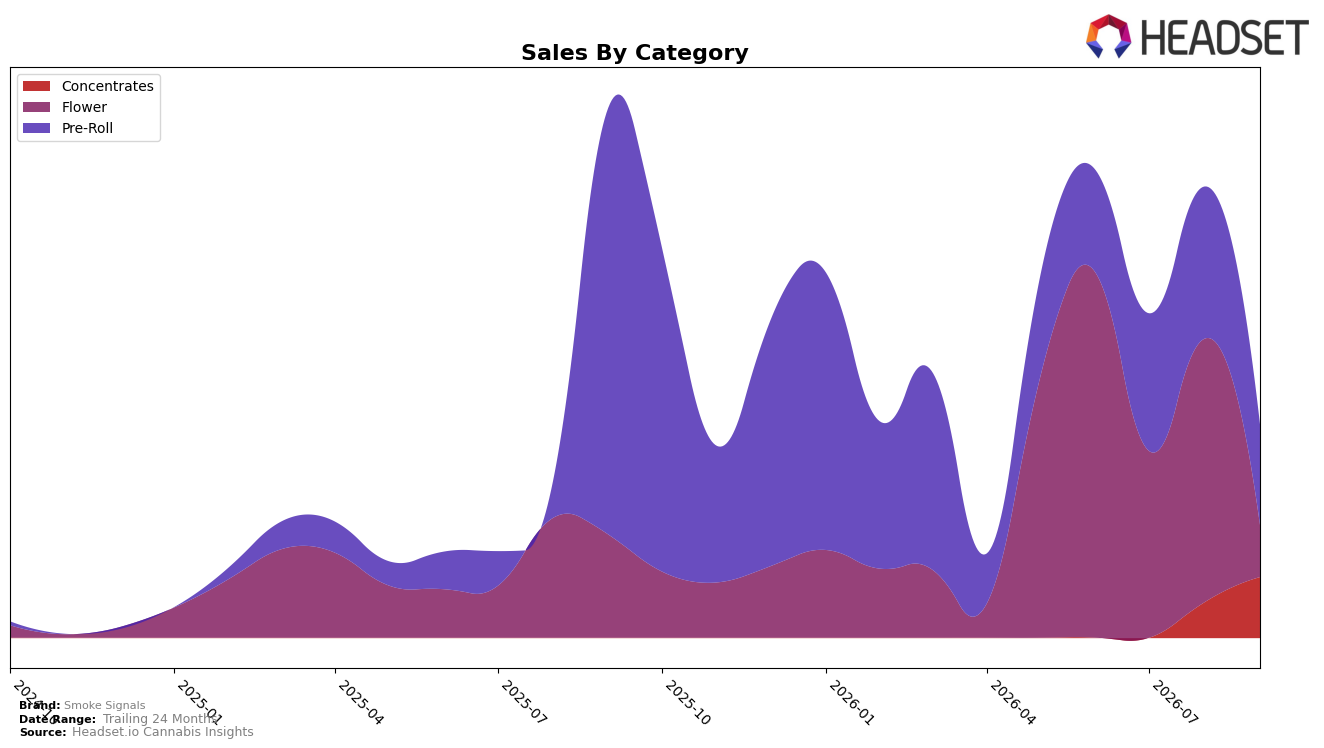
In September 2026, Smoke Signals’ mix tilted heavily to Pre-Roll at 47.19% share with a -76.45% year-over-year decline and a -33.87% month-over-month drop, while Flower held 24.29% share but fell -49.79% YoY and -80.37% MoM. Concentrates rose to 28.52% share on a 70.56% MoM surge, offsetting some volume loss as brand sales fell -59.80% YoY and average price climbed 97.16% YoY; within Nevada Pre-Rolls the brand sat at rank 44. The pattern implies a pivot away from volume-heavy Pre-Roll and Flower toward higher-ticket Concentrates, with the rank 44 position in Nevada Pre-Rolls and the -33.87% MoM Pre-Roll contraction underscoring a need to reweight the mix toward the segment now expanding 70.56% MoM.
With Pre-Roll down -76.45% YoY yet still 47.19% of sales and Flower collapsing -80.37% MoM at 24.29% share, the 28.52% share from Concentrates and its 70.56% MoM gain signal a margin-led repositioning as average price doubled 97.16% YoY. The implication is that maintaining rank 44 in Nevada Pre-Rolls while mix shifts toward Concentrates requires leaning into premium-priced formats to stabilize revenue as overall sales are down -59.80% YoY, with Concentrates emerging as the defensible anchor while Pre-Roll and Flower serve as secondary volume levers.
Competitive Landscape
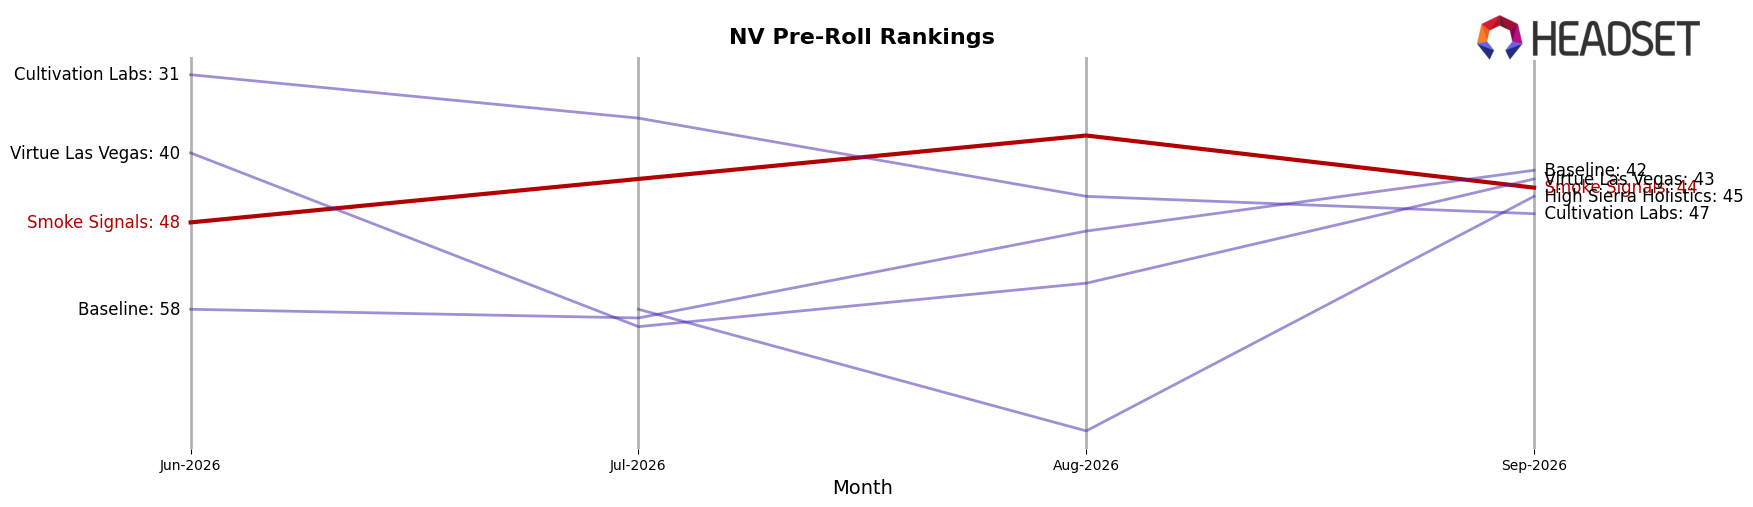
Smoke Signals sits at rank #44 in NV Pre-Roll for September 2026, sliding 28 positions year over year from #16, and down 4 spots from June 2026’s #48 to #44 most recently; the prior peak of #16 in September 2025 sets a clear contrast to today’s placement. Competitive pressure is concentrated at the top: Rove is #1 after a 4-rank YoY climb with sales up 44.6%, while STIIIZY holds #2 despite a 1-rank YoY dip and a 39.0% sales decline, indicating that ascent is still possible even amid negative growth for some leaders. The mix of a sharp YoY rank drop alongside a modest 3-month improvement implies Smoke Signals is stabilizing off its trough rather than returning to its September 2025 peak trajectory.
Notable Products
Black Runtz Pre-Roll (0.7g) posted the standout move in September 2026 with a 93.2% month-over-month jump and a climb to rank 2, while Mac #1 Pre-Roll (0.7g) fell 60.4% yet still held rank 3; this contrast indicates volatility within the same format rather than a category-wide upswing. Mystic Mint Pre-Roll (0.7g) advanced 38.9% to rank 1, and with four of the top five positions occupied by Pre-Roll SKUs, the assortment is concentrating at the value end of the menu where rapid share shifts can occur. The dominance of Pre-Rolls in ranks 1 through 5 alongside a single Flower SKU at rank 6 suggests Smoke Signals is leaning into quick-turn, lower unit-weight products over bulk formats, pointing to a strategy prioritizing velocity and trial over depth per transaction.
Top Selling Cannabis Brands






Data for this report comes from real-time sales reporting by participating cannabis retailers via their point-of-sale systems, which are linked up with Headset’s business intelligence software. Headset’s data is very reliable, as it comes digitally direct from our partner retailers. However, the potential does exist for misreporting in the instance of duplicates, incorrectly classified products, inaccurate entry of products into point-of-sale systems, or even simple human error at the point of purchase. Thus, there is a slight margin of error to consider. Brands listed on this page are ranked in the top twenty within the market and product category by total retail sales volume.

