.svg)


Where to Buy
Smoorhouse is stocked at 160 licensed dispensaries across Michigan, with the deepest coverage in New Buffalo, Grand Rapids, Monroe, Detroit, and Kalamazoo. Search by ZIP code or city below to find the closest one, or filter by product type if you are after a specific format.
Market Insights Snapshot
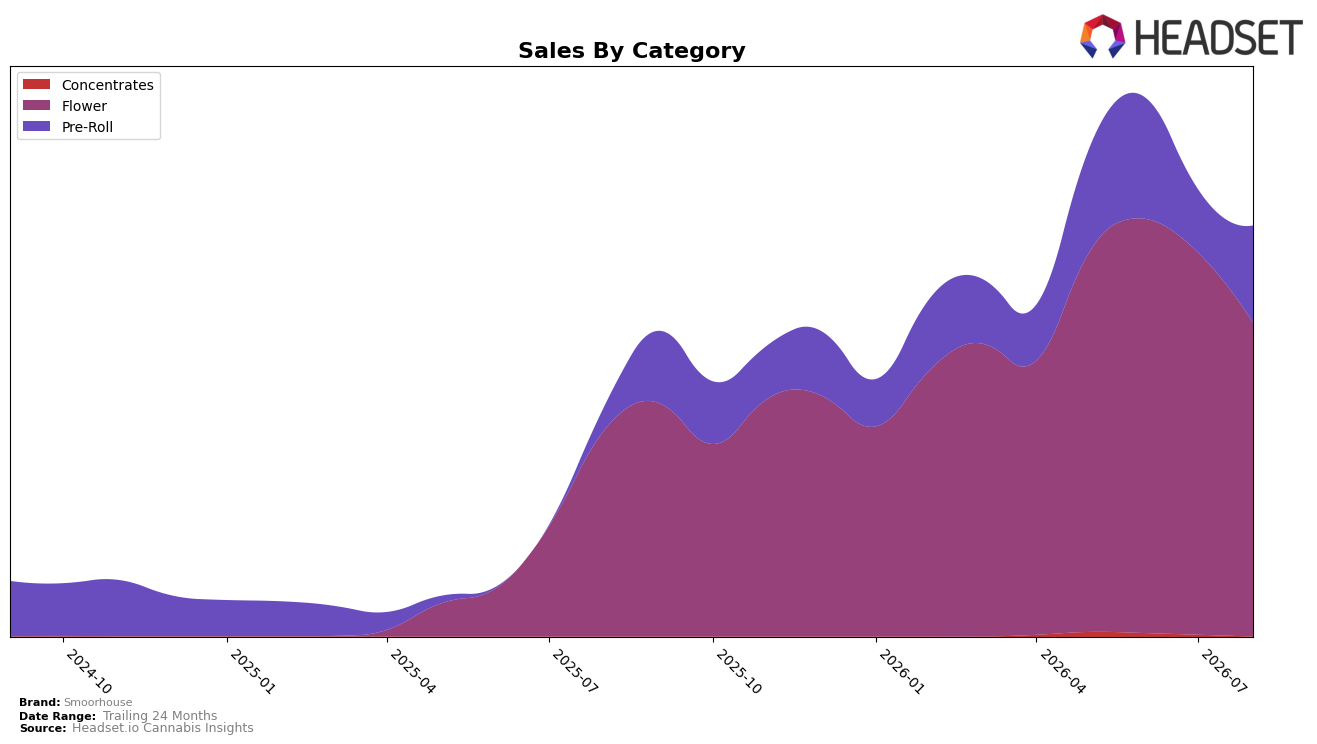
Smoorhouse concentrated 76.22% of August 2026 sales in Flower while Pre-Roll accounted for 23.78%, a mix that shifted as Flower declined -18.03% month over month and grew 52.07% year over year, whereas Pre-Roll surged 55.58% MoM and 315.06% YoY. Average price fell 22.00% YoY to $27.81 alongside brand sales growth of 79.05% YoY, and Smoorhouse held rank 42 in Flower within Michigan. The pattern implies Smoorhouse is diversifying beyond a Flower-led base as lower prices and accelerating Pre-Roll momentum rebalance volume and category exposure.
The rapid 315.06% YoY and 55.58% MoM gains in Pre-Roll against Flower’s 52.07% YoY and -18.03% MoM indicate Smoorhouse is shifting toward faster-turn formats without abandoning its 76.22% Flower core. Coupled with a 22.00% YoY price decrease and a 79.05% YoY brand sales lift, the mix change suggests a deliberate trade-down and pack-size strategy that expands reach and supports velocity, positioning Smoorhouse to improve relevancy beyond its current Flower rank of 42 in Michigan while reducing dependence on single-category swings.
Competitive Landscape
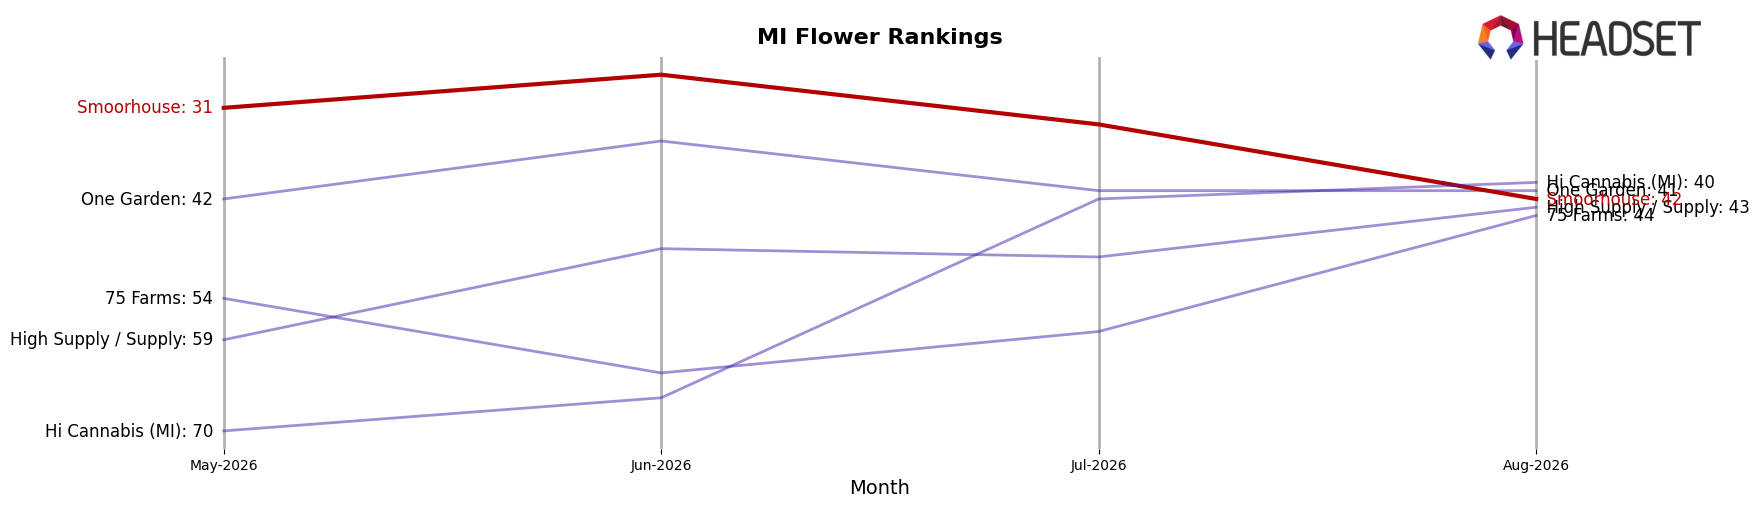
Smoorhouse sits at rank #42 in MI Flower in August 2026, improving 32 positions year over year from #74, but slipping 11 spots since May–August quarter where it was #31 and down 15 from its peak of #27 in June 2026; meanwhile, High Minded holds #1 with a -17.4% YoY sales change and NOBO advanced from #42 to #3 with a 506.8% YoY sales increase, indicating Smoorhouse’s annual gains are outpaced by faster climbers and recent momentum has cooled—implying the trajectory points to mid-tier stabilization unless near-term recovery reverses the 11-rank slide from the last three months.
Notable Products
Melonade Mimosa Bubble Hash Diamond Infused Flower (3.5g) posted the steepest movement in August 2026 with a -48.9% MoM decline to $31,233 while sliding to rank 9, whereas Pink Runtz Infused Pre-Roll 7-Pack (3.5g) climbed 35.3% MoM to hold rank 1; this spread indicates volatility is concentrated in select Flower SKUs even as flagship Pre-Rolls consolidate the top slot. Spiked Papaya Infused Flower (3.5g) fell -15.6% MoM at rank 7, while Electric Lantz Infused Flower (Bulk) gained 15.8% MoM at rank 3, and four of the top ten are Flower SKUs, suggesting category breadth but uneven week-to-week velocity. With Pre-Rolls occupying ranks 1, 2, 4, and 5 and two of those lacking reported MoM baselines, the mix implies Smoorhouse is leaning into multi-pack infused formats for share defense while Flower requires tighter SKU pruning and clearer price-pack architecture.
Top Selling Cannabis Brands






Data for this report comes from real-time sales reporting by participating cannabis retailers via their point-of-sale systems, which are linked up with Headset’s business intelligence software. Headset’s data is very reliable, as it comes digitally direct from our partner retailers. However, the potential does exist for misreporting in the instance of duplicates, incorrectly classified products, inaccurate entry of products into point-of-sale systems, or even simple human error at the point of purchase. Thus, there is a slight margin of error to consider. Brands listed on this page are ranked in the top twenty within the market and product category by total retail sales volume.

