May-2026
Sales
Trend
6-Month
Product Count
SKUs
Avg Price
YoY Sales Change
YoY Price Change
Market Insights Snapshot
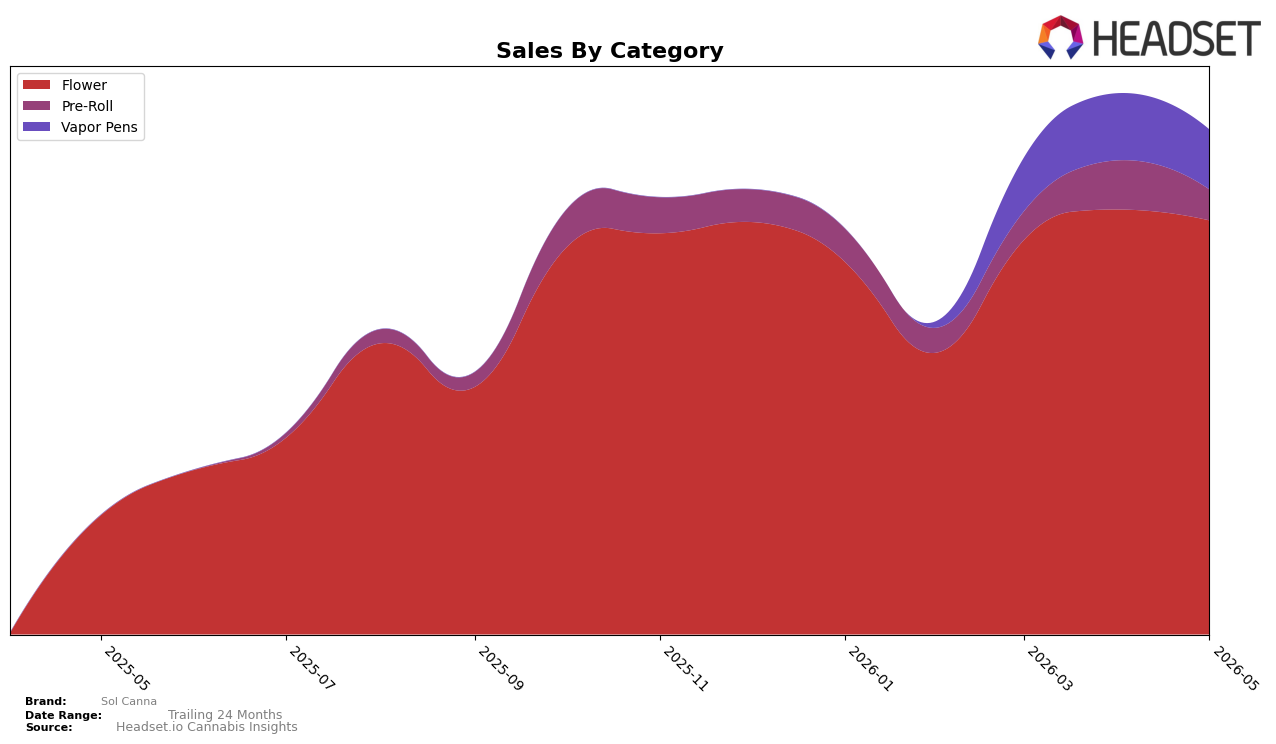
Sol Canna’s category mix in May 2026 is concentrated in Flower at 82.10% share with 247.53% year-over-year growth and a month-over-month decline of 2.57%, while Vapor Pens hold 11.84% share with a 10.67% month-over-month decline and Pre-Roll sits at 6.06% share with a 37.41% month-over-month decline. The brand’s average price fell 22.87% year over year to $35.98, and within Flower the average price sits at $46.31, signaling a downshift in ticket size even as unit velocity expands; the pattern implies reliance on Flower-led unit growth while peripheral formats contract month over month.
With Flower ranked 11 in Illinois and controlling 82.10% of Sol Canna’s mix, the 2.57% month-over-month pullback alongside double-digit month-over-month declines in Vapor Pens (10.67%) and Pre-Roll (37.41%) suggests the portfolio is narrowing toward its core rather than building breadth. Coupled with a 247.53% year-over-year surge in Flower against a 22.87% brand-level price decrease, the configuration indicates a value-leaning, Flower-first positioning where scale is coming from volume and rank stability around 11 depends on sustaining Flower share while selectively arresting declines in smaller categories.
Competitive Landscape
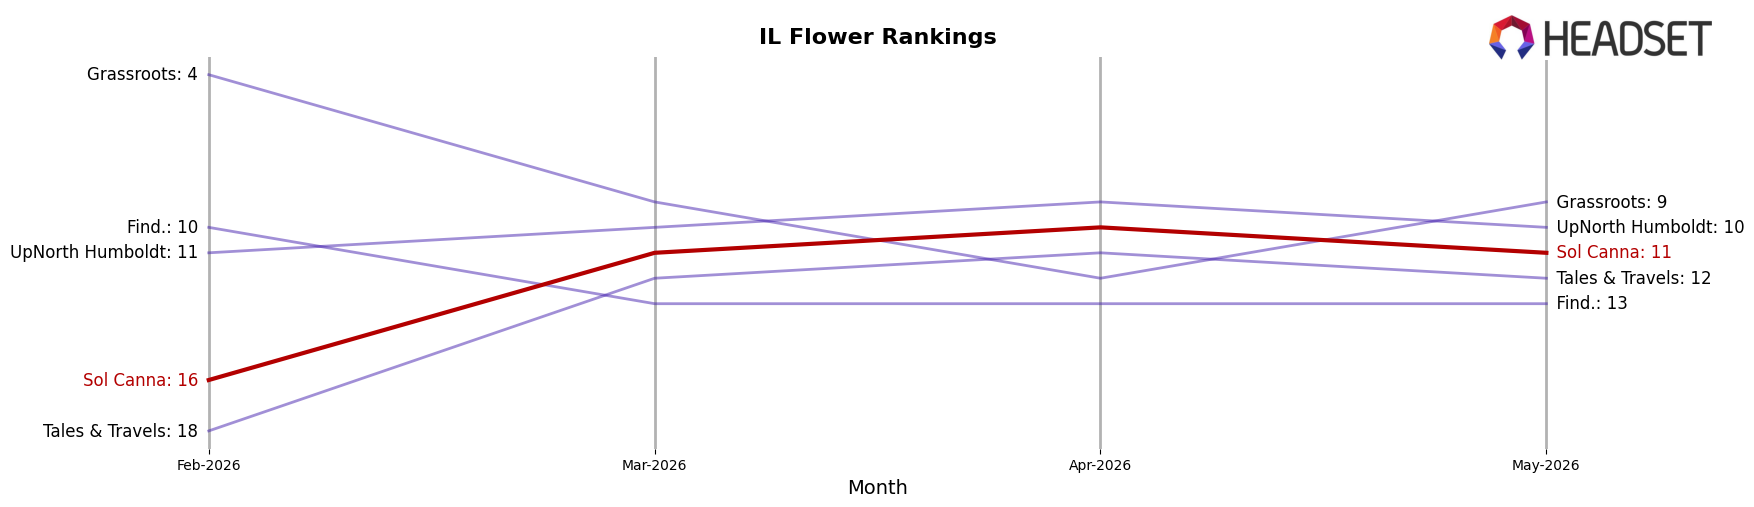
Sol Canna sits at rank #11 in IL Flower in May 2026, up 26 positions from #37 year over year, and 5 spots better than its #16 placement in February 2026; however, it is one notch below its peak of #10 in April 2026. Against the competitive set, High Supply / Supply held #1 both year over year and in May 2026 while growing sales 29.8%, and RYTHM stayed at #2 despite a 12.2% sales decline, indicating Sol Canna’s climb is driven more by share capture below the top two than by displacement at the very top. This trajectory—rapid YoY ascent (+26 ranks) but a slight pullback from April 2026’s #10 to May 2026’s #11—implies Sol Canna is consolidating gains in the edge of the top 10, with near-term movement hinging on converting April momentum into sustained rank improvement.
Notable Products
Cadillac Rainbows (3.5g) posted the steepest decline in May 2026 at -27.0% and slid to rank 9, while Northern Lights Distillate Cartridge (1g) fell -27.4% to rank 2, indicating sharp demand compression at both a flagship vapor pen and a premium flower SKU. Pink Lemonade Distillate Cartridge (1g) edged up +2.2% and held rank 1 as three of the top five ranks are vapor pens, whereas Strawberry Jam Distillate Cartridge (1g) dropped -15.6% at rank 3 alongside Sour Diesel Distillate Cartridge (1g) at -16.1% and rank 5. With Shady Boof Popcorn (7g) down -10.8% at rank 6 and the Shady Boof family appearing twice in the top ten, the pattern points to a portfolio leaning on cartridges for rank stability while value-leaning flower softens, implying Sol Canna’s near-term commercial direction favors maintaining vapor pen leadership over broad flower recovery.
Top Selling Cannabis Brands
Data for this report comes from real-time sales reporting by participating cannabis retailers via their point-of-sale systems, which are linked up with Headset’s business intelligence software. Headset’s data is very reliable, as it comes digitally direct from our partner retailers. However, the potential does exist for misreporting in the instance of duplicates, incorrectly classified products, inaccurate entry of products into point-of-sale systems, or even simple human error at the point of purchase. Thus, there is a slight margin of error to consider. Brands listed on this page are ranked in the top twenty within the market and product category by total retail sales volume.

