.svg)


Market Insights Snapshot
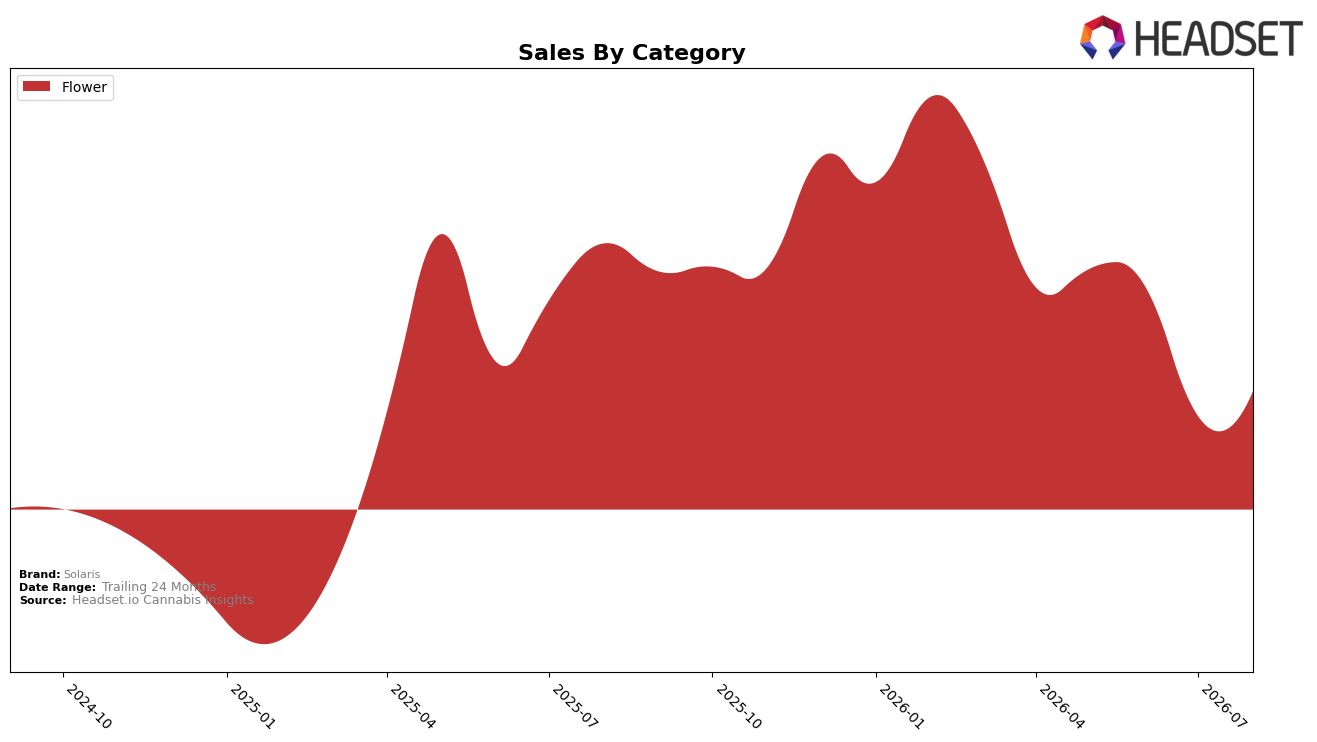
In August 2026, Solaris operated as a single-category brand with Flower representing 100.0% of sales, while category sales declined year over year by 55.09% and expanded month over month by 26.18%. Average price fell 45.34% YoY to $15.44 alongside a rank position of 31 in Flower within Nevada, indicating volume recovery MoM against a weaker YoY base. The pattern implies a price-led, Flower-only rebound that lifts short-term velocity MoM but leaves the annual trajectory compressed, concentrating risk in a single category and a mid-tier state-category rank.
The combination of a 26.18% MoM sales gain and a 45.34% YoY price decline suggests Solaris is trading for share via discounting while holding a 100.0% Flower mix and a rank of 31 that limits premium positioning. With YoY sales down 55.09% despite the MoM uptick, the current stance favors volume elasticity over margin and narrows differentiation to Flower-only, implying Solaris’s positioning skews toward value-driven Flower in Nevada rather than diversified, higher-rank exposure.
Competitive Landscape
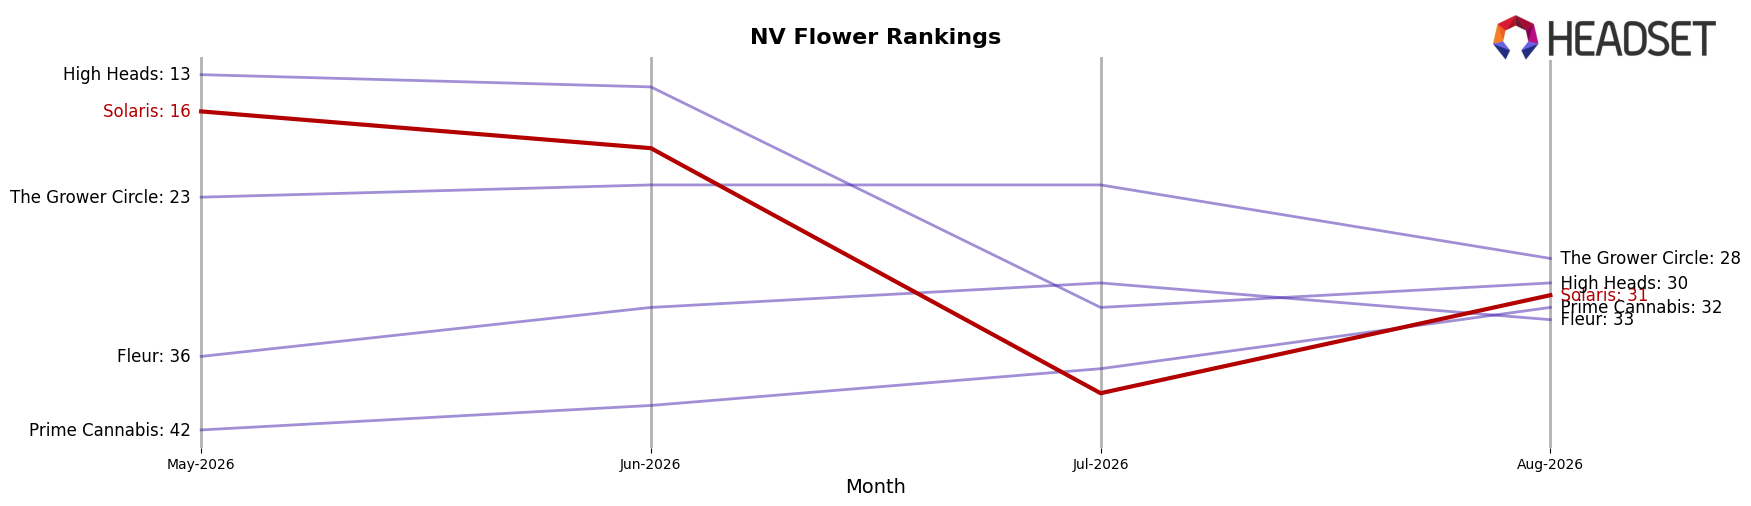
Solaris sits at rank 31 in NV Flower for August 2026, down 14 places year over year from rank 17, and 15 places below its three-month position at rank 16; meanwhile, the brand is 19 spots off its peak at rank 12 reached in February 2026. Competitive movement is running the other way: STIIIZY advanced from rank 2 to rank 1 with a 50.5% year-over-year sales increase, and Redwood jumped from rank 23 to rank 5 on 218.1% growth, while Good Green held steady at rank 4 despite a 16.8% sales decline. The pattern implies Solaris is losing share of shelf and shopper attention to faster-rising leaders, and without a reversal of the 14-place annual slide and 15-place drop versus three months ago, the brand’s trajectory points toward further de-prioritization in retailer assortments.
Notable Products
Chemical Cookies (3.5g) posted the largest move in August 2026, jumping 863% MoM to rank 1 while Jealousy (3.5g) fell 45% MoM at rank 3, indicating a sharp intra-month share transfer within Flower. Runtz (7g) climbed 129% MoM to rank 8 and Jealousy (1g) rose 68% MoM at rank 2, and with all top-10 SKUs in Flower, concentration in a single category is peaking even as formats split between 1g, 3.5g, and 7g. Chemical Cookies (3.5g) alone generated $59,200 and outpaced other Solaris SKUs by rank and growth rate, implying that push-size eighths are the current demand lever while legacy winners require price-pack resets.
Top Selling Cannabis Brands






Data for this report comes from real-time sales reporting by participating cannabis retailers via their point-of-sale systems, which are linked up with Headset’s business intelligence software. Headset’s data is very reliable, as it comes digitally direct from our partner retailers. However, the potential does exist for misreporting in the instance of duplicates, incorrectly classified products, inaccurate entry of products into point-of-sale systems, or even simple human error at the point of purchase. Thus, there is a slight margin of error to consider. Brands listed on this page are ranked in the top twenty within the market and product category by total retail sales volume.

