.svg)


Where to Buy
Sonoran Roots is stocked at 23 licensed dispensaries across Arizona, with the deepest coverage in Tucson, Mesa, Scottsdale, Sun City, and Tempe. Search by ZIP code or city below to find the closest one, or filter by product type if you are after a specific format.
Market Insights Snapshot
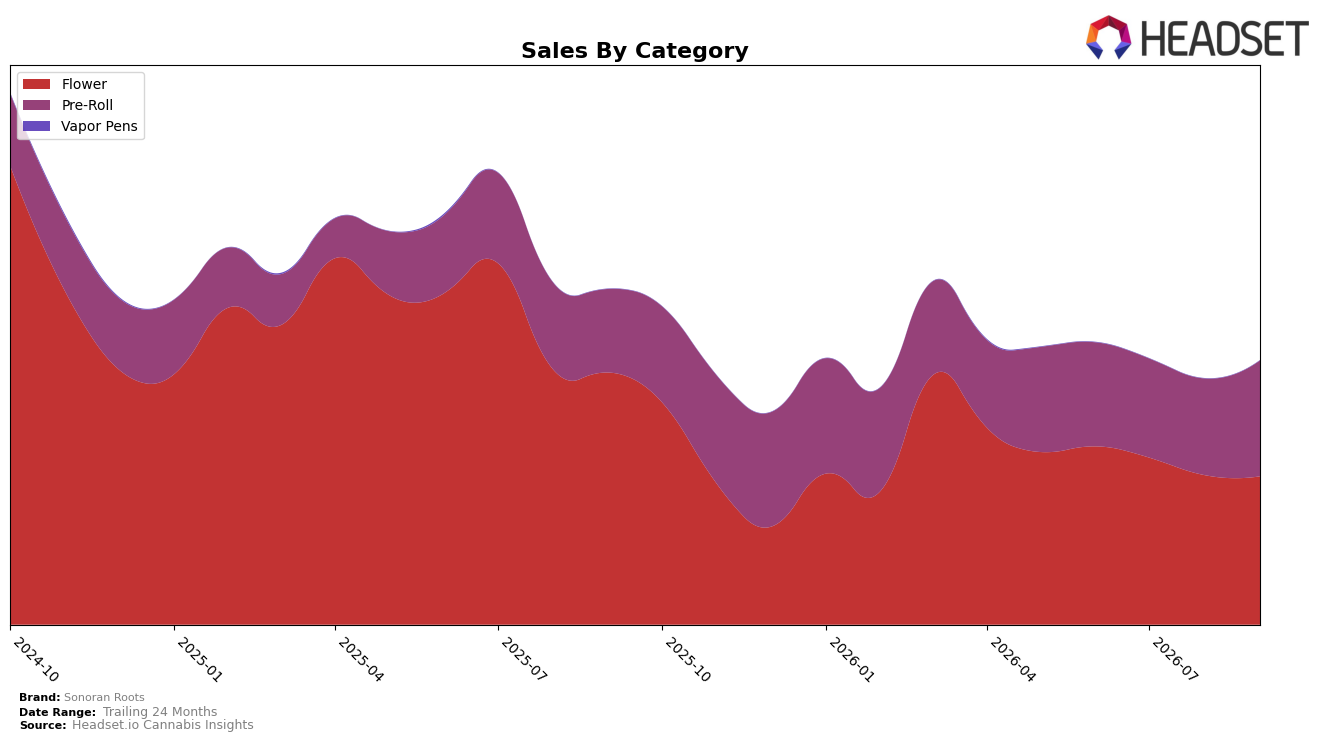
In September 2026, Sonoran Roots concentrated sales in two categories: Flower at 56.17% share and Pre-Roll at 43.83% share, with Flower down 41.22% year over year and 0.80% month over month while Pre-Roll rose 38.82% year over year and 20.00% month over month. Despite overall brand sales falling 21.34% year over year and the average price declining 40.25%, the mix tilt toward Pre-Roll helped offset Flower contraction, implying a pivot toward lower-price, higher-velocity formats within Arizona.
The category reweighting positions Sonoran Roots as a value-forward player: a 40.25% drop in average price alongside a 19.997% month-over-month Pre-Roll surge signals price-sensitive demand capture, while maintaining a 56.17% Flower anchor provides breadth even as that category slid 41.22% year over year. Holding rank 25 in Arizona Flower while Pre-Roll gains share suggests near-term differentiation via format and pricing rather than premium Flower leadership, implying resource allocation should prioritize sustaining Pre-Roll momentum to stabilize total sales while selectively defending core Flower SKUs.
Competitive Landscape
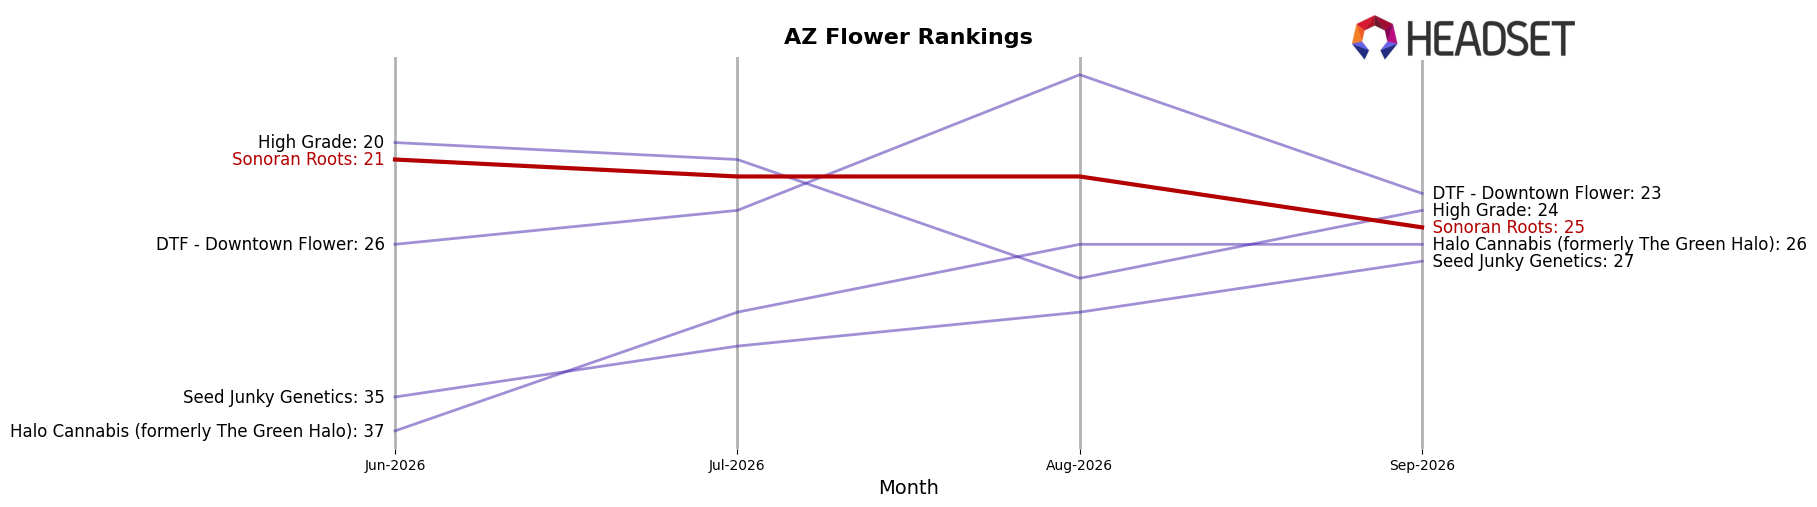
Sonoran Roots sits at rank 25 in AZ Flower in September 2026, down 11 positions year over year from rank 14, and 4 positions lower than June 2026 when it was rank 21; against its historical peak of rank 6 in September 2024, the current placement marks a 19-rank slide. Meanwhile, Just Flower held at rank 1 year over year with a 29.0% sales increase, and Find. moved from rank 3 to rank 2 alongside a 56.6% sales lift, while Loud Pax surged from rank 51 to rank 5 with a 2,181.5% sales change; these upward moves contrast with Sonoran Roots’ drop from rank 21 to rank 25 over the last three months, indicating that competitors are outpacing it in velocity and that the current rank trajectory implies further share erosion unless the brand re-enters the top-20 corridor.
Notable Products
Cranebow City #3 Pre-Roll (1g) posted the sharpest move in September 2026, dropping -54.98% MoM and sliding to rank 6 while Superboof Pre-Roll (1g) also declined -46.70% MoM at rank 10, indicating volatility at the lower end of the top 10. In contrast, Hooch Pre-Roll (1g) rose +25.02% MoM to rank 4, and five of the top six ranks are unchanged null-to-date entries, concentrating momentum at the very top where rank 1 and rank 2 hold without reported MoM swings. With all ten SKUs in Pre-Roll and the top three ranks occupied by Sunset Cliffs Pre-Roll (1g), Melted Strawberries Pre-Roll (1g), and Soda Fountain Pre-Roll (1g), the assortment is heavily tilted to a single format and relies on rank stability rather than broad-based MoM growth, implying Sonoran Roots is prioritizing depth in flagship Pre-Rolls over expanding variety. The pattern suggests a need to backfill losses from double-digit decliners with targeted support for mid-pack climbers like Hooch Pre-Roll (1g) while preserving the dollar volume lead near $51,000 at rank 1 to sustain category dominance.
Top Selling Cannabis Brands






Data for this report comes from real-time sales reporting by participating cannabis retailers via their point-of-sale systems, which are linked up with Headset’s business intelligence software. Headset’s data is very reliable, as it comes digitally direct from our partner retailers. However, the potential does exist for misreporting in the instance of duplicates, incorrectly classified products, inaccurate entry of products into point-of-sale systems, or even simple human error at the point of purchase. Thus, there is a slight margin of error to consider. Brands listed on this page are ranked in the top twenty within the market and product category by total retail sales volume.

