.svg)

Sep-2026
Sales
Trend
6-Month
Product Count
SKUs
Avg Price
YoY Sales Change
YoY Price Change


Where to Buy
Southern Oregon Family Farms is stocked at 12 licensed dispensaries across Oregon, with the deepest coverage in Coos Bay, Eugene, Bandon, Beaverton, and Medford. Search by ZIP code or city below to find the closest one, or filter by product type if you are after a specific format.
Market Insights Snapshot
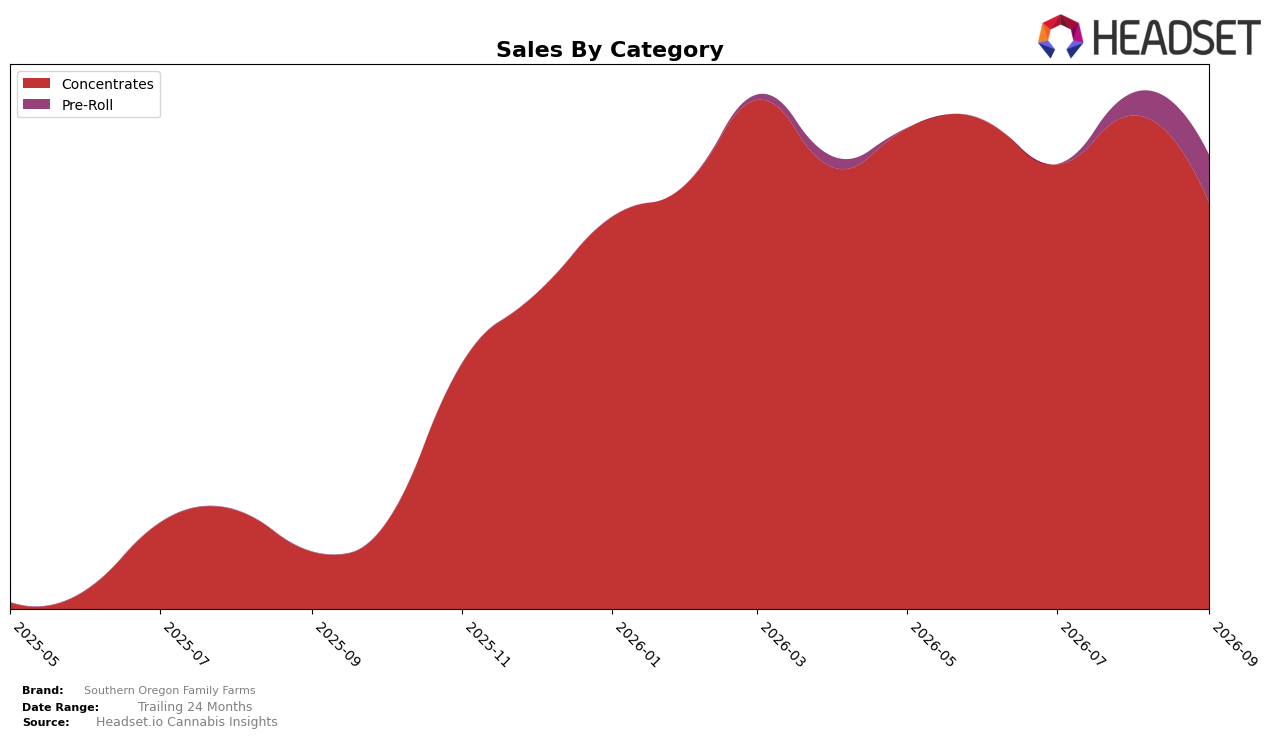
In September 2026, Southern Oregon Family Farms derived 89.45% category share from Concentrates with a 611.47% year-over-year change alongside a 17.82% month-over-month decline, while Pre-Roll accounted for 10.55% share with a 113.02% month-over-month increase and no prior-year baseline. The brand’s average price fell 39.83% year over year to $8.33, while Concentrates’ average ticket sat at 11.80, pointing to a mix-led price gap versus the portfolio average. With Concentrates ranked 28th in Oregon and holding nearly nine-tenths of sales, the pattern implies expansion was driven by a large, lower-priced Concentrates volume surge that is now tempering month over month as Pre-Roll scales quickly from a small base.
The combination of a 611.47% year-over-year gain in Concentrates and a 113.02% month-over-month rise in Pre-Roll indicates reliance on a single anchor category is easing, even as Concentrates slipped 17.82% month over month and still holds 89.45% share. With the 39.83% price decrease coinciding with rapid unit growth and a 28th-place Concentrates rank in Oregon, the pattern implies the brand is trading into a value-led lane to build velocity while gradually diversifying via Pre-Roll to reduce category concentration risk.
Competitive Landscape
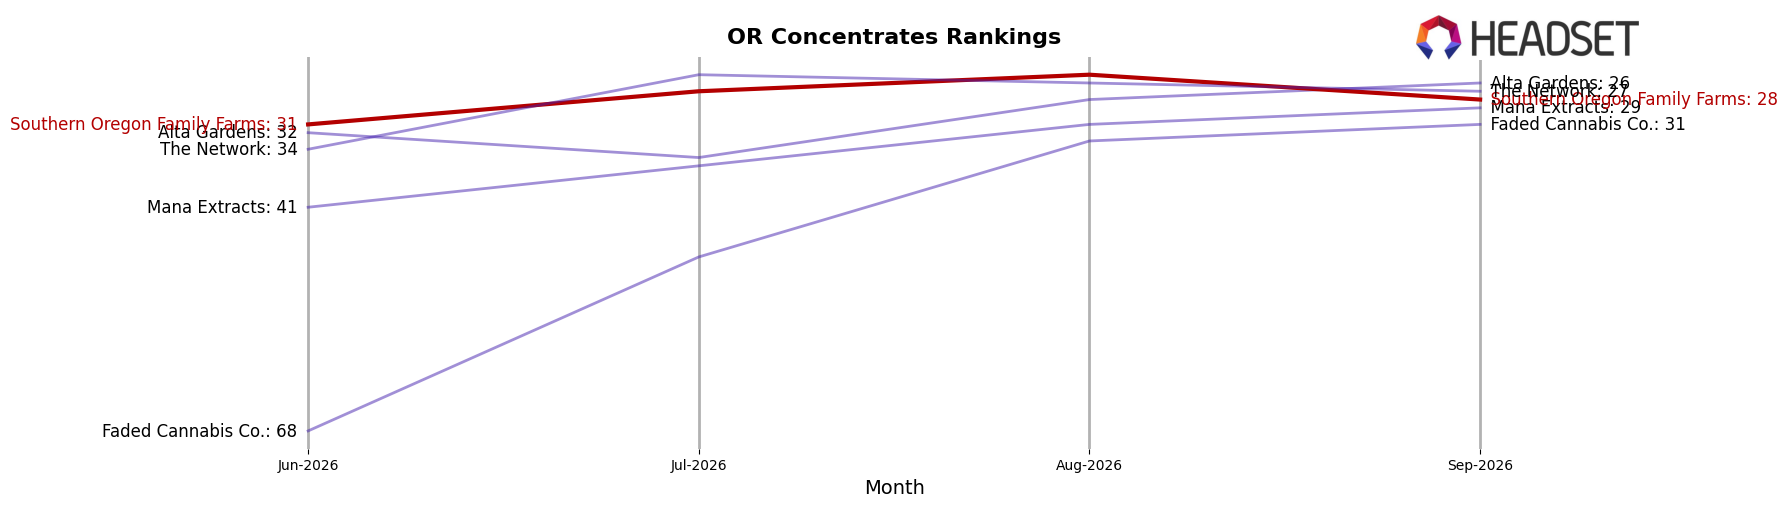
Southern Oregon Family Farms sits at rank #28 in OR Concentrates for September 2026 after a 68-position climb from #96 year over year, and it improved 3 spots from #31 in June 2026 while peaking at #25 in August 2026. Against the leaders, Altered Alchemy held #1 both this year and last while growing sales 23.9% year over year, and Oregrown moved up from #3 to #2 with 38.4% year-over-year sales growth; by contrast, Red Eye Extracts (OR) slipped from #2 to #3 with an 11.0% sales decline, signaling that Southern Oregon Family Farms’ rise from #96 to #28 aligns more with the upward cohort than the contracting tier. The combination of a 68-rank YoY jump and a near-term move from #31 to #28, punctuated by an August 2026 peak at #25, implies a trajectory toward the low-20s that is contingent on sustaining momentum against competitors consolidating the top five.
Notable Products
Honey Tree Pre-Roll 2-Pack (1g) posted the standout move in September 2026 with a 122% month-over-month jump to rank 1, while Platinum Gusher Pre-Roll 2-Pack (2g) also surged 101% to rank 3. Four of the top ten are Pre-Roll SKUs, concentrated in 2-packs, versus Concentrates holding ranks 2 and 5 with only a 2.3% and 10.4% MoM lift respectively. This split—triple-digit gains in Pre-Rolls against single-digit growth in Concentrates—implies Southern Oregon Family Farms is tilting demand and merchandising toward fast-turn Pre-Roll formats rather than extraction-led volume.
Top Selling Cannabis Brands






Data for this report comes from real-time sales reporting by participating cannabis retailers via their point-of-sale systems, which are linked up with Headset’s business intelligence software. Headset’s data is very reliable, as it comes digitally direct from our partner retailers. However, the potential does exist for misreporting in the instance of duplicates, incorrectly classified products, inaccurate entry of products into point-of-sale systems, or even simple human error at the point of purchase. Thus, there is a slight margin of error to consider. Brands listed on this page are ranked in the top twenty within the market and product category by total retail sales volume.

