.svg)

Sep-2026
Sales
Trend
6-Month
Product Count
SKUs
Avg Price
YoY Sales Change
YoY Price Change


Where to Buy
Space Ranger is stocked at 23 licensed dispensaries across New Jersey, with the deepest coverage in Bordentown, Clementon, Elmwood Park, Evesham, and Ewing Township. Search by ZIP code or city below to find the closest one, or filter by product type if you are after a specific format.
Market Insights Snapshot
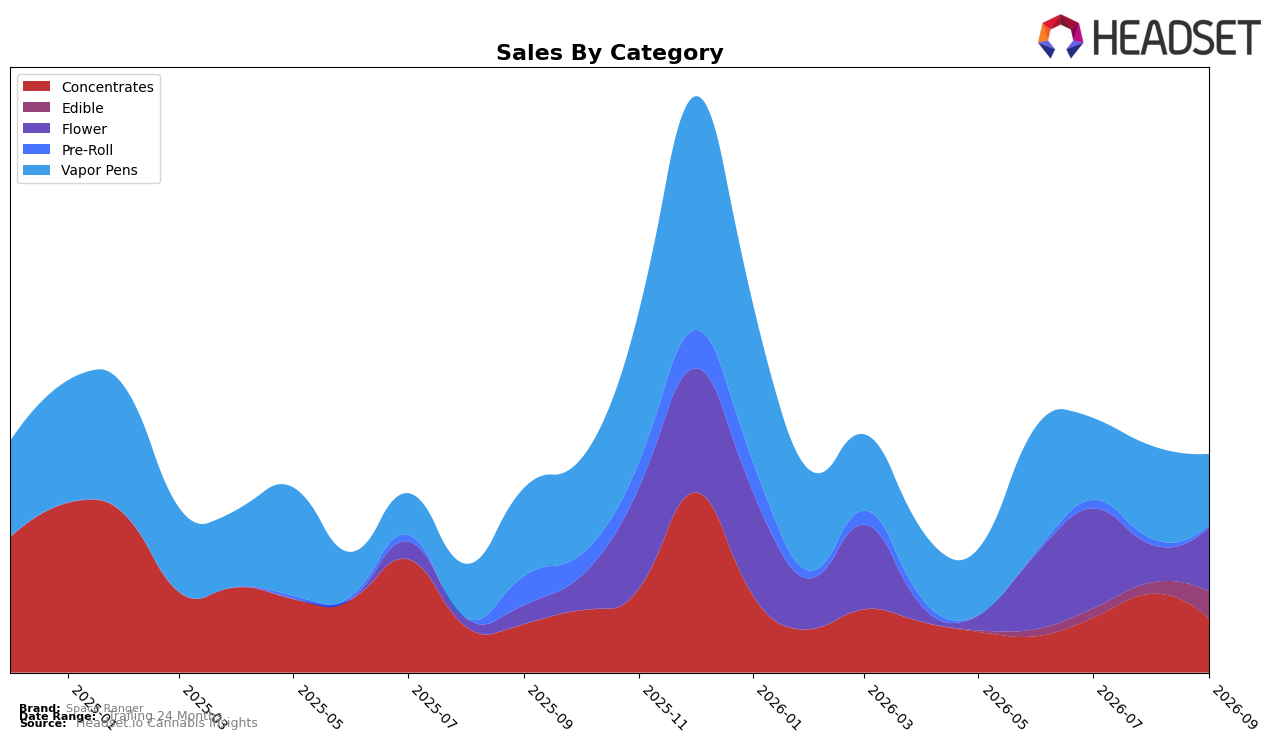
Space Ranger’s category mix in September 2026 pivoted toward Flower and Edible while Vapor Pens and Concentrates contracted, reshaping share even as total brand sales rose 18.34% year over year and average price advanced 11.94%. Vapor Pens held the largest share at 32.41% but declined sharply with a -20.00% YoY and -23.89% MoM drop, while Flower climbed to 29.66% share on a 245.69% YoY and 70.20% MoM surge; Concentrates maintained 24.51% share but slipped -32.11% MoM alongside a 10.72% YoY gain, and Edible expanded MoM by 145.52% to 12.45% share despite no YoY baseline. With Pre-Roll shrinking to 0.98% share on -92.64% YoY and -63.00% MoM declines, the pattern implies Space Ranger is reweighting volume toward inhalables led by Flower and away from Vapor Pens month to month, while still carrying a premium price architecture at an average of $33.18.
This mix transition suggests a positioning shift from a Vapor Pen-led identity toward a broader inhalable portfolio anchored by Flower, which can buffer volatility in pen demand yet requires reinforcement where the brand is ranked 73 in Vapor Pens in New Jersey. The simultaneous -23.89% MoM in Vapor Pens and 70.20% MoM in Flower indicates cross-category substitution within the basket, and the 145.52% MoM rise in Edible provides an entry path for value-seeking shoppers under $15 while average category price points near $47 in Vapor Pens, Flower, and Concentrates sustain premium signaling. The implication is that Space Ranger can lean into Flower and Edible to capture near-term momentum while using price-led differentiation to stabilize pen share where performance lags, with the mix change functioning as a hedge against single-category exposure.
Competitive Landscape
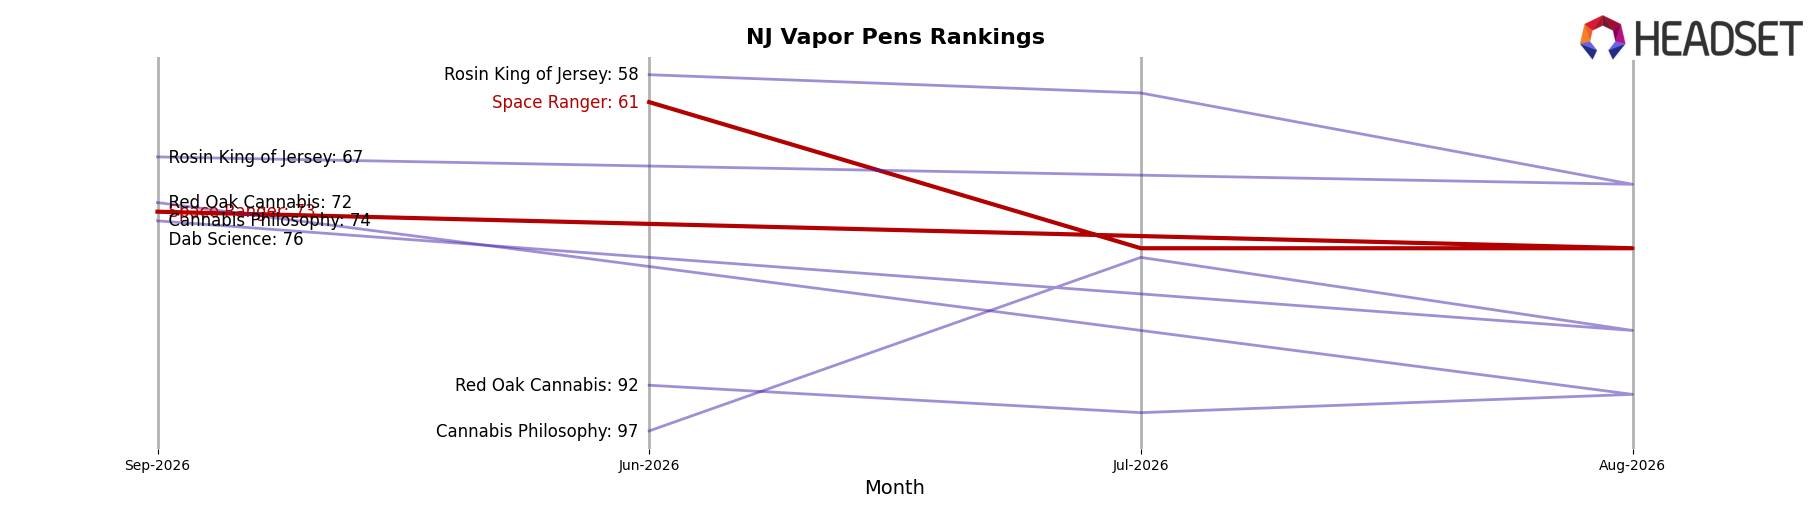
Space Ranger sits at rank #73 in New Jersey Vapor Pens in September 2026, down 12 positions year over year from #61, and 12 positions below its June 2026 mark of #61, while still far off its peak of #38 reached in January 2025; in contrast, Fernway holds #1 after rising from #2 year over year with a 19.2% sales lift, and Select slipped from #1 to #2 alongside a 24.0% sales decline. Relative to the top five, where Legend remains #3 with a 16.4% sales contraction and RYTHM is steady at #5 with a 9.2% decline, Space Ranger’s 12-rank YoY retreat and failure to recover from its January 2025 peak indicate a trajectory of share erosion rather than temporary volatility, implying that without a corrective push on assortment or price, further rank slippage is the base case.
Notable Products
Rocket Pop Gummies 10-Pack (100mg) posted the standout move in September 2026 with a 160.6% month-over-month surge to rank 1, while Peach Stardust x Suncake Infused Pre-Roll (1g) fell 63.0% and slid to rank 10; this bifurcation implies consumer momentum is concentrating in ingestibles while combustion-based offerings retreat. Meteor Melon Fast Acting Gummies 10-Pack (100mg) climbed 147.0% to rank 2 as Vapor Pens showed mixed traction with Rocket Fuel Distillate Disposable (2g) dropping 14.9% at rank 4, and three of the top ten are Edible SKUs, pointing to a shift in basket composition toward fast-acting confections over inhalables and single-stick formats.
Top Selling Cannabis Brands






Data for this report comes from real-time sales reporting by participating cannabis retailers via their point-of-sale systems, which are linked up with Headset’s business intelligence software. Headset’s data is very reliable, as it comes digitally direct from our partner retailers. However, the potential does exist for misreporting in the instance of duplicates, incorrectly classified products, inaccurate entry of products into point-of-sale systems, or even simple human error at the point of purchase. Thus, there is a slight margin of error to consider. Brands listed on this page are ranked in the top twenty within the market and product category by total retail sales volume.

