.svg)
Aug-2026
Sales
Trend
6-Month
Product Count
SKUs
Avg Price
YoY Sales Change
YoY Price Change


Market Insights Snapshot
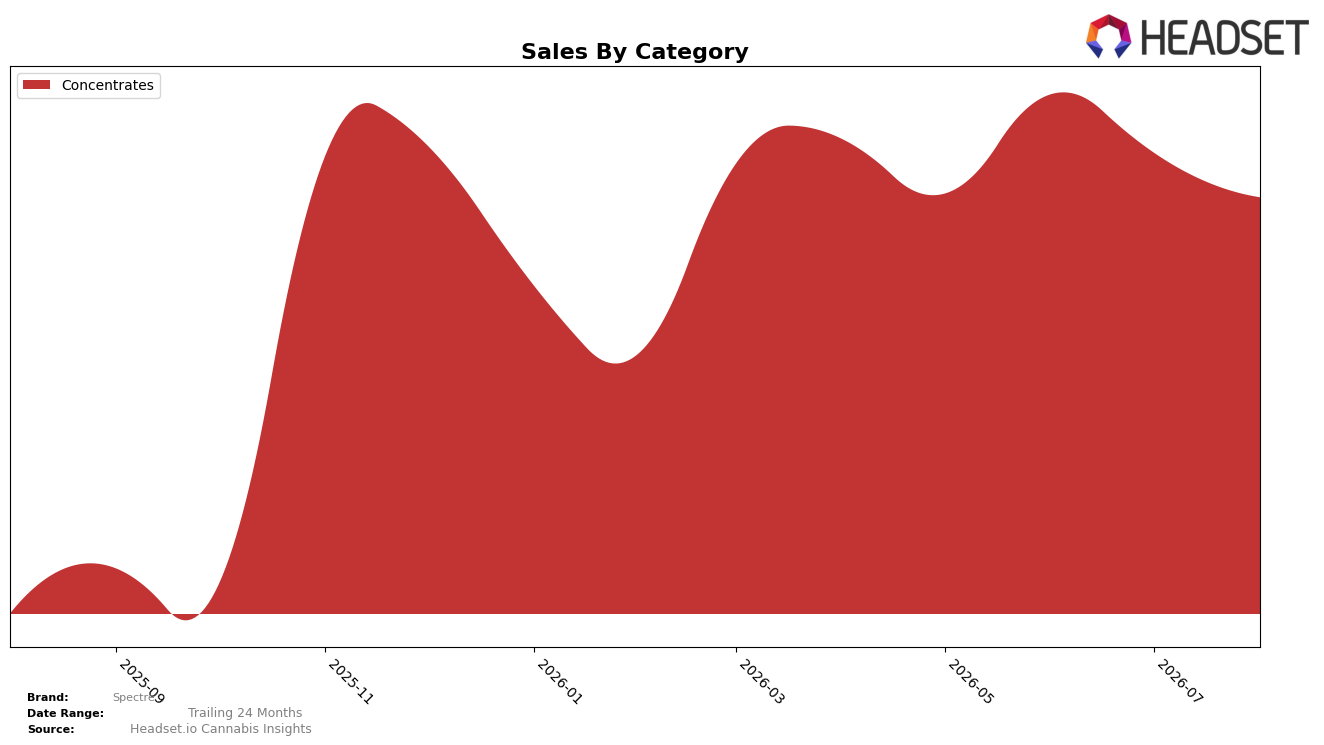
In August 2026, Spectre operated as a single-category brand with Concentrates at 100.0% of mix, pairing a year-over-year sales change of 1,116.9% with a month-over-month decline of 9.0%. Average price fell 15.5% YoY alongside a category share that remained fully concentrated at 100.0%, while rank in Alberta Concentrates sat at position 41. The pattern implies a volume-led rebound centered entirely in Concentrates, with price compression and a lower August cadence pressuring near-term momentum despite the elevated YoY base.
These shifts position Spectre as a focused Concentrates specialist whose growth engine is tightly linked to a single format, where a 1,116.9% YoY surge coexists with a 9.0% MoM pullback. With average price down 15.5% YoY and rank at 41 in Alberta, the mix concentration suggests the brand is trading for velocity within one lane rather than gaining breadth, implying that sustaining share will hinge on reinforcing repeat purchase and defending unit throughput rather than diversifying categories in the short term.
Competitive Landscape
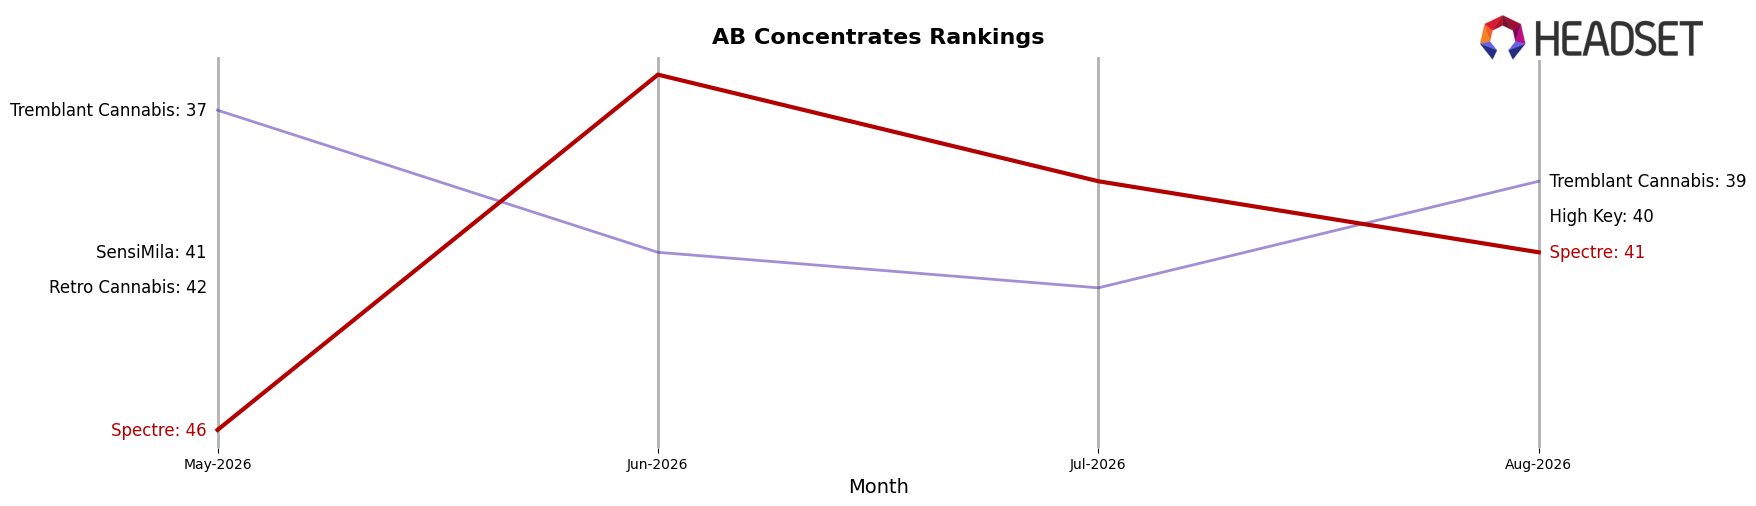
Spectre sits at rank #41 in AB Concentrates in August 2026, up 6 positions from #47 in May 2026 and down 5 from its peak at #36 in June 2026, indicating a recent rebound after a mid-summer slip; by contrast, BoxHot held #1 with a -2.6% YoY sales change while Sticky Greens surged to #5 from #49 YoY with +1,486.7% sales growth, and Endgame remained #2 despite a -21.6% YoY sales decline. The combination of a 6-rank improvement since May 2026 and a 5-rank gap from June 2026’s peak implies Spectre’s trajectory is stabilizing mid-pack, requiring share capture against faster-climbing rivals to convert short-term recovery into sustained rank gains.
Notable Products
Operation Orange Liquid Diamond Dabber (1g) led the narrative in August 2026 with a -18.1% month-over-month drop while holding rank 1, indicating demand pressure at the very top alongside a likely price or distribution constraint signaled by a single-month revenue of $10,005. Glitch Shatter x Aged Sticky Hash (1.5g) rose 13.1% MoM at rank 2, narrowing the performance gap and increasing the risk of rank volatility if the divergence persists. With both of the top two SKUs in Concentrates, the category concentration at the summit coupled with a simultaneous decline at rank 1 and growth at rank 2 implies Spectre is tilting toward a depth-boost strategy within Concentrates rather than broadening its product mix.
Top Selling Cannabis Brands






Data for this report comes from real-time sales reporting by participating cannabis retailers via their point-of-sale systems, which are linked up with Headset’s business intelligence software. Headset’s data is very reliable, as it comes digitally direct from our partner retailers. However, the potential does exist for misreporting in the instance of duplicates, incorrectly classified products, inaccurate entry of products into point-of-sale systems, or even simple human error at the point of purchase. Thus, there is a slight margin of error to consider. Brands listed on this page are ranked in the top twenty within the market and product category by total retail sales volume.

