.svg)


Where to Buy
Suckers is stocked at 14 licensed dispensaries across Maryland, with the deepest coverage in Baltimore, Bethesda, Catonsville, Laurel, and Middle River. Search by ZIP code or city below to find the closest one.
Market Insights Snapshot
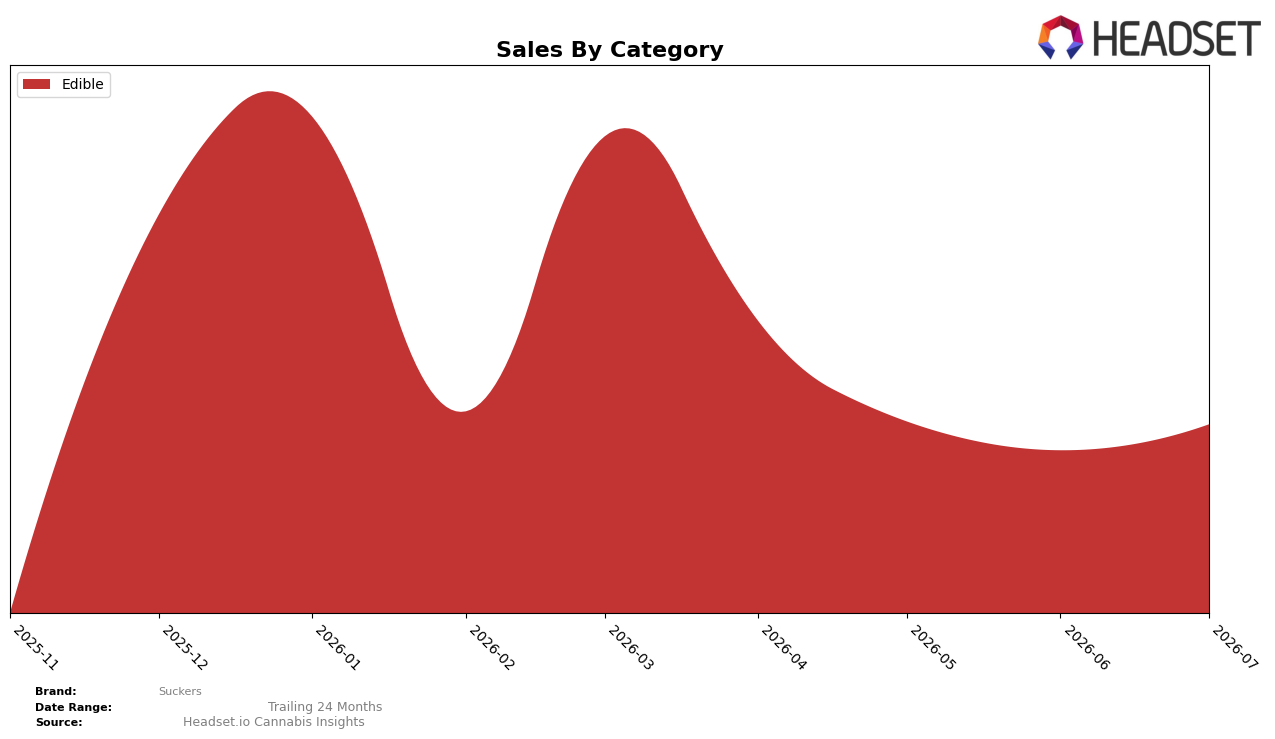
In July 2026, Suckers operated as a single-category brand with Edible at 100.0% mix, and the category’s month-over-month change was 7.8% alongside a 0-rank movement in its category footprint due to the absence of other categories. With no measurable year-over-year percentage available and a 100.0% concentration in Edible, the relevant signal is the 7.8% MoM lift paired with a flat cross-category rank context in Maryland, implying the brand is deepening within one lane rather than broadening its portfolio.
This consolidation means price and velocity in Edible will set positioning: a $19.27 average price intersecting with a 7.8% MoM uptick indicates demand elasticity within a narrow range and a potential volume-led gain without cross-category hedging. The lack of a year-over-year figure alongside a 100.0% category share suggests exposure to seasonal and regulatory swings within Edible, so the near-term thesis is to trade deeper on Edible trip drivers while monitoring whether the 7.8% MoM lift can repeat in August 2026 or convert into rank advancement in Maryland.
Competitive Landscape
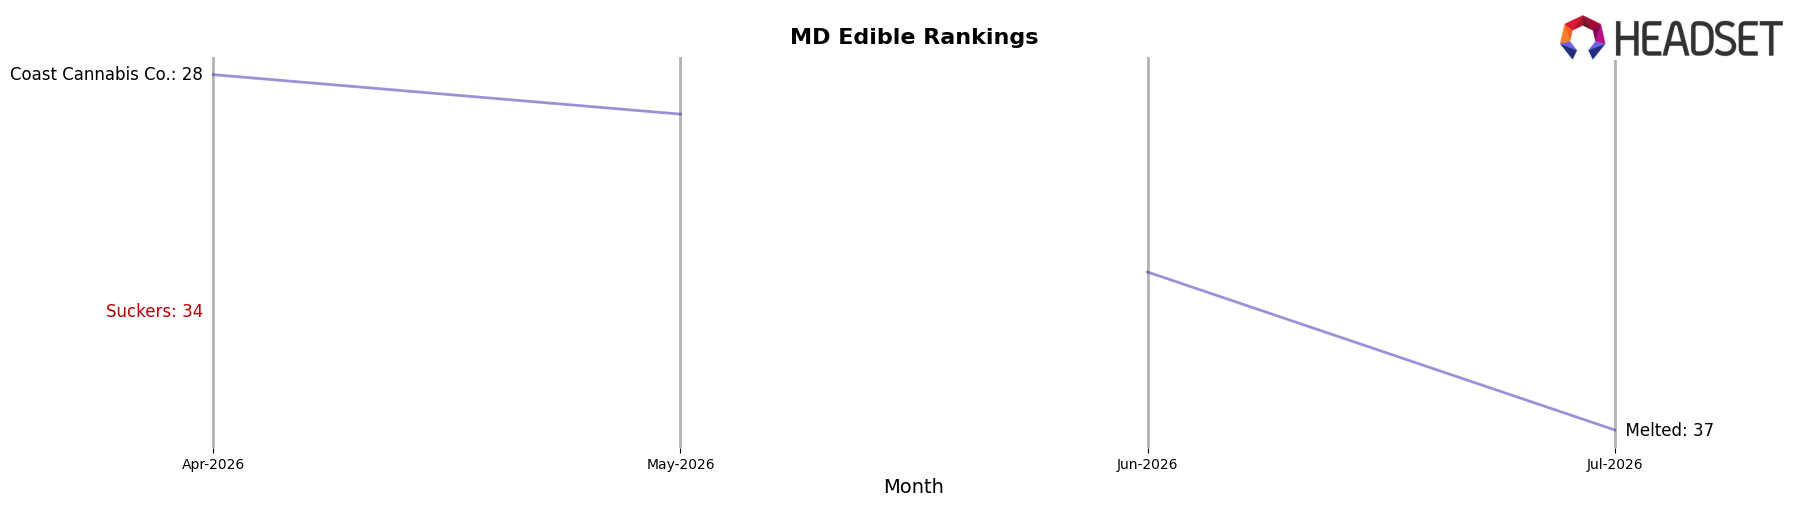
Suckers is ranked #40 in MD Edible in July 2026, down 6 positions from #34 in April 2026 and 9 spots below its peak of #31 in March 2026; the lack of a year-over-year rank baseline contrasts with category leaders where Incredibles rose to #1 from #3 year over year and Wyld slipped to #4 from #1 as its sales fell 18.99%. Against mid-tier momentum, In House advanced to #3 from #6 with 74.75% YoY sales growth while Curio Wellness held #5 despite an 11.48% YoY sales decline, indicating that Suckers’ 6-rank slide over the last three months occurred amid both upward and downward competitor mobility; the pattern implies Suckers is losing rank share in a reshuffling field and must reverse multi-month slippage to avoid drifting further from its March 2026 peak.
Notable Products
Sour Apple Zing Hard Candy 10-Pack (100mg) delivered the standout movement in July 2026 with a +157.4% month-over-month surge to $2,525 and a climb to rank 2, while Very Cherry Hard Lozenges 10-Pack (100mg) fell -31.3% and sits tied at rank 3. Cloudberry Hard Lozenges 10-Pack (100mg) remains rank 1 despite a -8.3% decline, and Sour Apple Zing Hard Lozenges (100mg) edged down -1.6% at rank 3. With all top positions occupied by Edible lozenge and candy formats, the tilt toward sour-candy momentum alongside weakening cherry lozenges implies Suckers is rotating demand toward high-velocity sour variants within the Edible line.
Top Selling Cannabis Brands






Data for this report comes from real-time sales reporting by participating cannabis retailers via their point-of-sale systems, which are linked up with Headset’s business intelligence software. Headset’s data is very reliable, as it comes digitally direct from our partner retailers. However, the potential does exist for misreporting in the instance of duplicates, incorrectly classified products, inaccurate entry of products into point-of-sale systems, or even simple human error at the point of purchase. Thus, there is a slight margin of error to consider. Brands listed on this page are ranked in the top twenty within the market and product category by total retail sales volume.

