.svg)

Sep-2026
Sales
Trend
6-Month
Product Count
SKUs
Avg Price
YoY Sales Change
YoY Price Change


Where to Buy
Sugar Nest Extracts is stocked at 81 licensed dispensaries across Michigan, with the deepest coverage in Muskegon, Grand Rapids, Kalamazoo, New Buffalo, and Constantine. Search by ZIP code or city below to find the closest one, or filter by product type if you are after a specific format.
Market Insights Snapshot
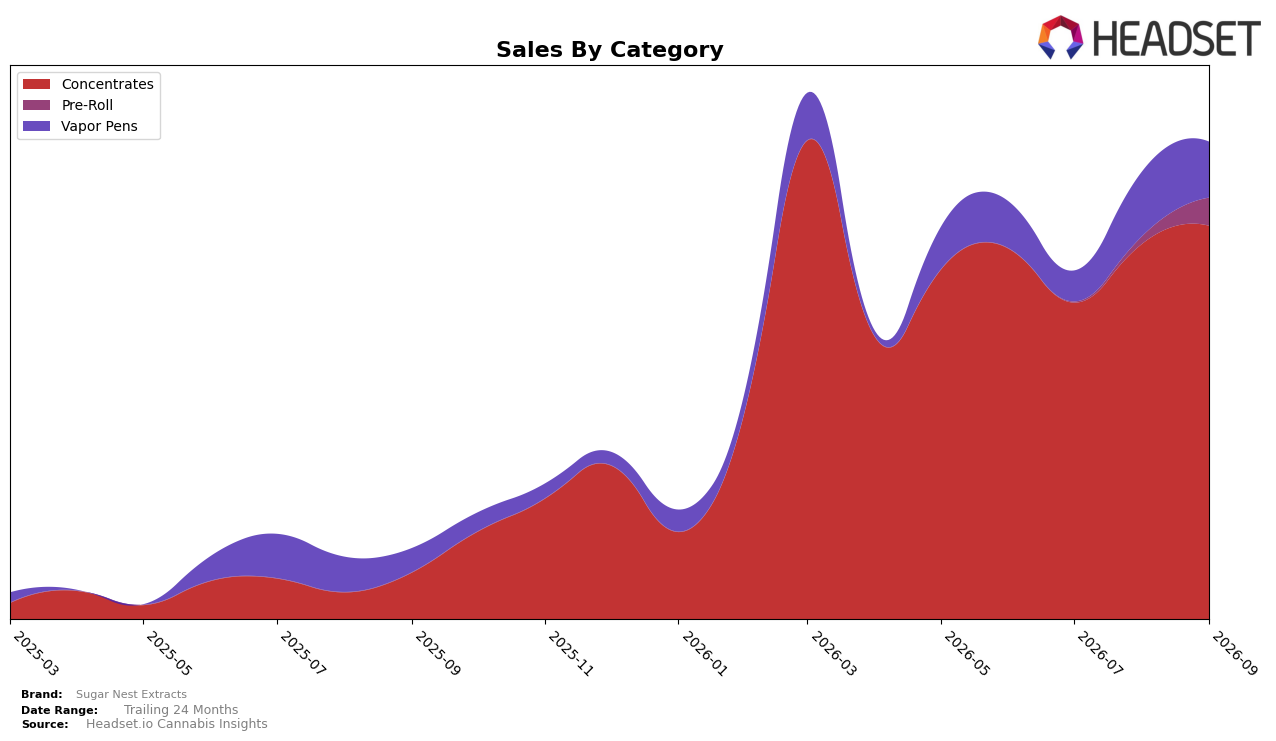
Concentrates held 82.53% share in September 2026 with 750.43% year-over-year growth and 4.92% month-over-month, while Vapor Pens sat at 11.63% share with 133.38% year-over-year but declined 13.69% month-over-month; Pre-Roll rose to 5.83% share with a 288.72% month-over-month surge and no year-over-year baseline. The brand’s average price increased 5.03% year-over-year to $9.74, with Concentrates priced at $9.40 and Vapor Pens at $21.45, indicating mix-driven revenue concentration alongside a price step-up. The pattern implies Sugar Nest Extracts is consolidating around Concentrates as the demand engine while using Pre-Roll as a fast-expanding on-ramp, with Vapor Pens retrenching month-over-month despite triple-digit year-over-year expansion.
In Michigan Concentrates, Sugar Nest Extracts ranked 16th, and with Concentrates at 82.53% of brand sales versus Vapor Pens at 11.63%, the portfolio skews toward a category where incremental rank gains hinge on sustaining the 4.92% month-over-month cadence rather than relying on Pre-Roll’s 288.72% spike. The combination of a 5.03% year-over-year price lift and a heavier Concentrates mix increases volume dependence in a mid-pack rank position, implying the path to higher share is to stabilize Vapor Pens’ 13.69% month-over-month decline while preserving Concentrates’ 750.43% year-over-year momentum.
Competitive Landscape
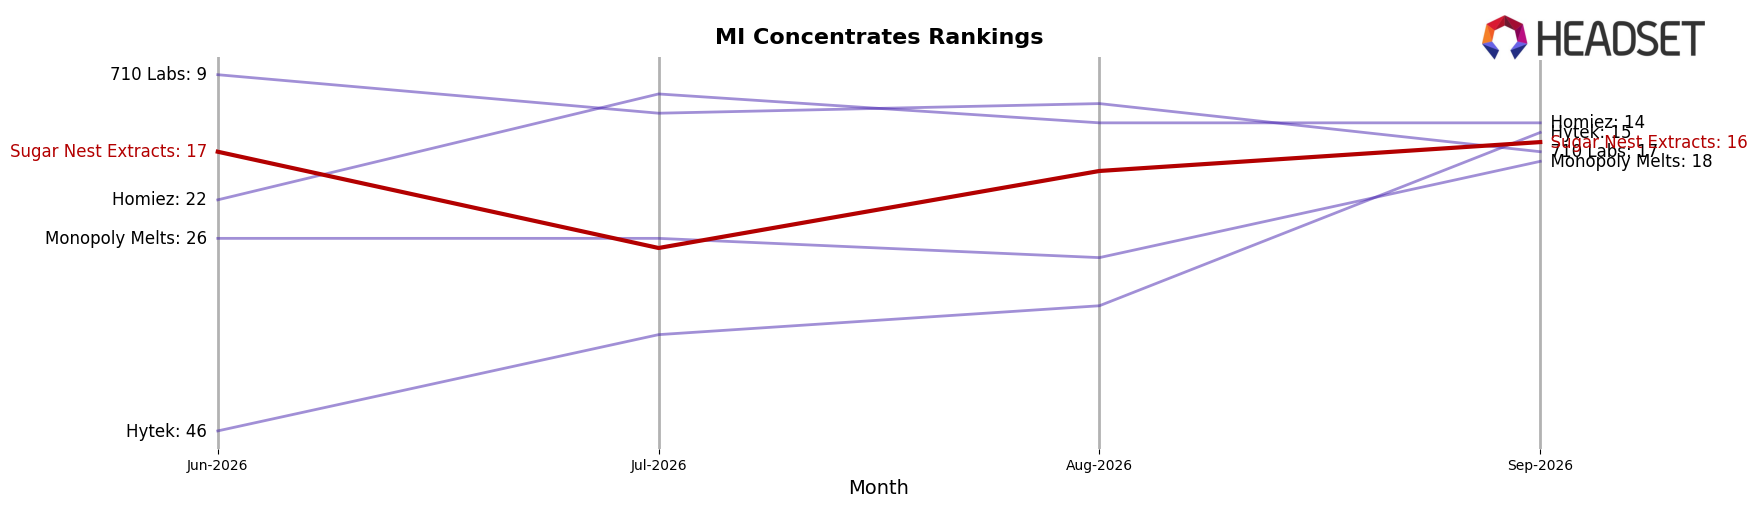
Sugar Nest Extracts ranks #16 in MI Concentrates in September 2026, improving 89 positions year over year from #105, and nudging up 1 spot from #17 in June 2026, while its peak of #14 in March 2026 indicates recent slippage of 2 ranks from that high; by contrast, Rkive Cannabis moved from #3 to #1 and Uniq Pressure climbed from #96 to #3 with 2,216.9% YoY sales growth, signaling that Sugar Nest Extracts’ upward trajectory is real but being outpaced by faster risers, implying a need to convert mid-year momentum into sustained share capture before leadership positions consolidate.
Notable Products
Runtz Badder (1g) posted the steepest decline in September 2026, falling 48.5% month over month and landing at rank 7, while Greasy Runtz Live Resin (1g) slipped 8.7% and sits at rank 6. The top 10 is entirely Concentrates, and four SKUs occupy ranks 1–4, indicating depth at the premium end even as mid-tier SKUs retrench. Juicy J Cured Resin (1g) holds rank 1 and Blueberry Bang Bang Live Resin (1g) sits at rank 9, framing a spread where higher-ranked items concentrate share as lower performers contract. This pattern implies Sugar Nest Extracts is consolidating around flagship Concentrates while pruning or deprioritizing underperforming variants, nudging the mix toward fewer, higher-velocity SKUs.
Top Selling Cannabis Brands






Data for this report comes from real-time sales reporting by participating cannabis retailers via their point-of-sale systems, which are linked up with Headset’s business intelligence software. Headset’s data is very reliable, as it comes digitally direct from our partner retailers. However, the potential does exist for misreporting in the instance of duplicates, incorrectly classified products, inaccurate entry of products into point-of-sale systems, or even simple human error at the point of purchase. Thus, there is a slight margin of error to consider. Brands listed on this page are ranked in the top twenty within the market and product category by total retail sales volume.

