Jul-2025
Sales
Trend
6-Month
Product Count
SKUs
Avg Price
YoY Sales Change
YoY Price Change
Market Insights Snapshot
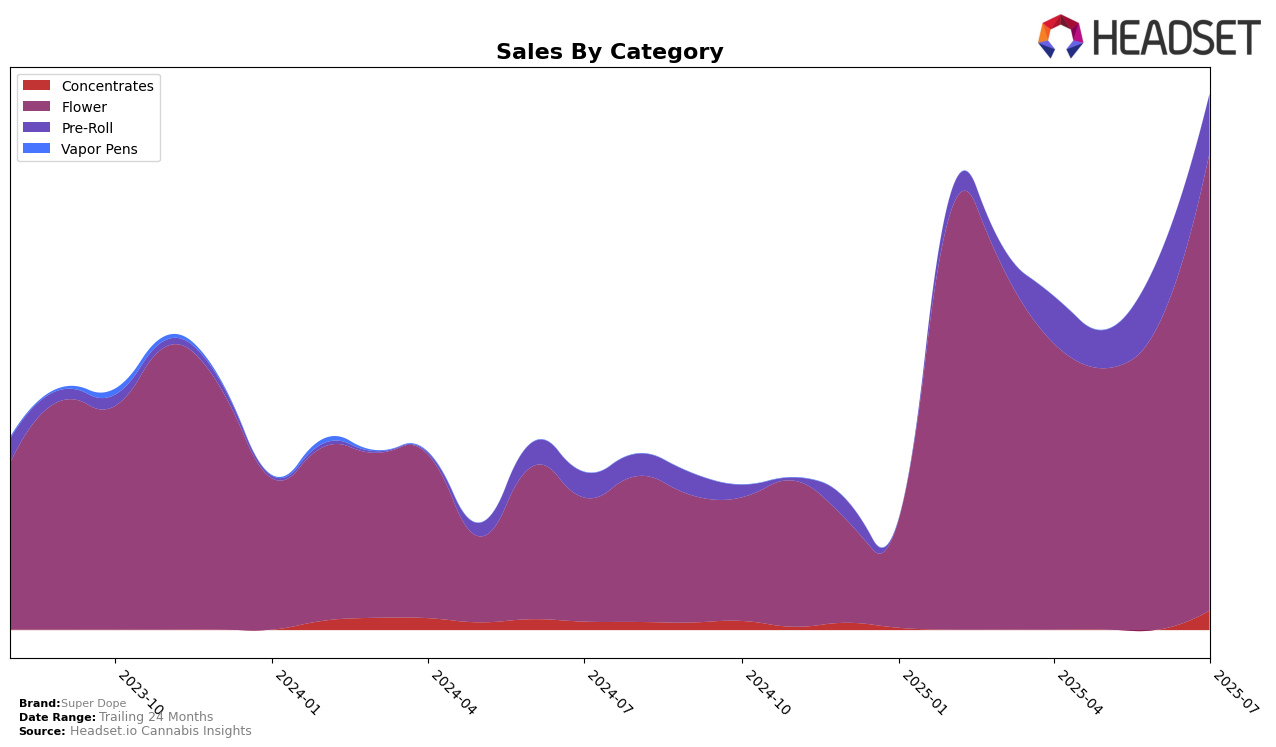
In the competitive cannabis market of New York, Super Dope has shown notable performance fluctuations across different product categories. In the concentrates category, Super Dope made its debut in the top 30 brands in July 2025, indicating a strategic entry or improvement in market presence. This suggests a growing acceptance or increased consumer interest in their concentrate offerings. Meanwhile, in the flower category, the brand exhibited a positive upward trend, climbing from a rank of 86 in May 2025 to 51 by July 2025. This steady improvement reflects a strengthening position and possibly enhanced product appeal or distribution in the flower segment.
Despite not being in the top 30 for concentrates in the earlier months of April through June, their eventual appearance in July could be seen as a strategic breakthrough, highlighting potential growth opportunities in this segment. On the other hand, the flower category's rank improvements suggest that Super Dope might be focusing more resources or marketing efforts there, as evidenced by the significant jump in sales from April to July. This could imply that while the brand is gaining traction in concentrates, it is already establishing a more robust presence in the flower market of New York. Such movements are crucial for stakeholders to monitor as they could indicate future strategic directions for the brand.
Competitive Landscape
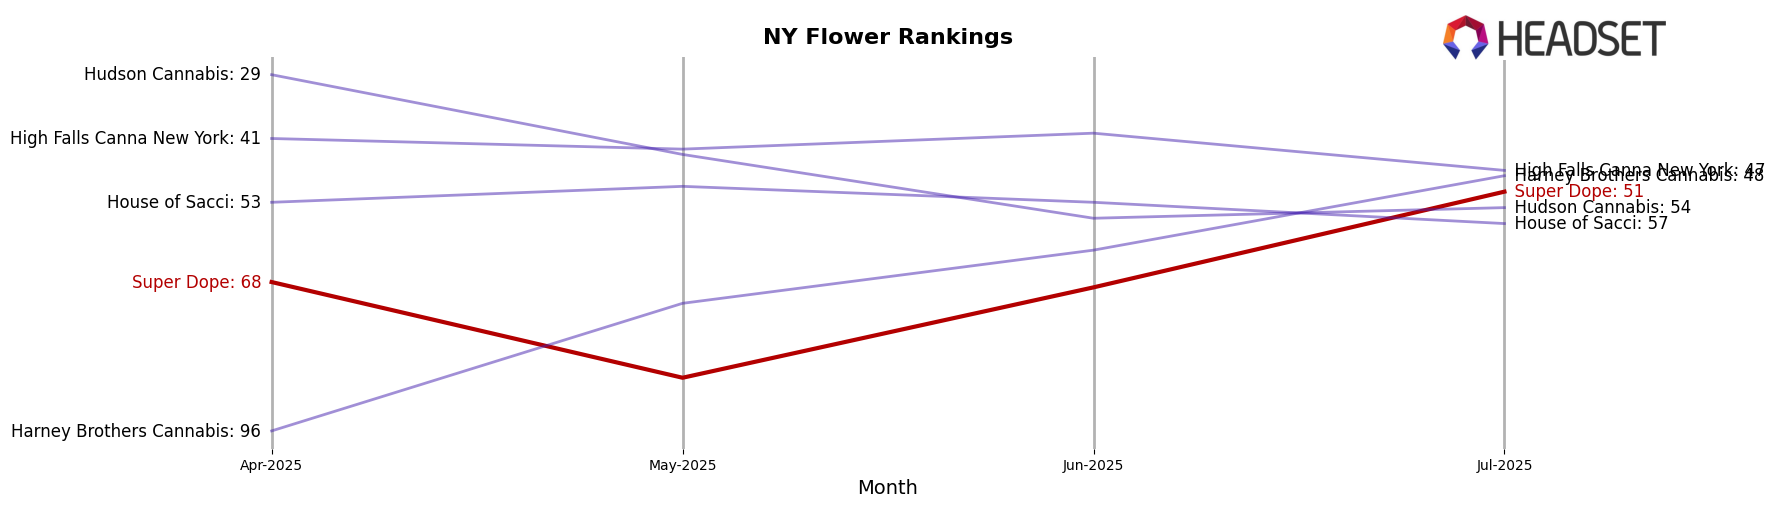
In the competitive landscape of the Flower category in New York, Super Dope has experienced notable fluctuations in its ranking and sales performance from April to July 2025. Starting at rank 68 in April, Super Dope saw a dip to rank 86 in May, before rebounding to rank 69 in June and achieving a significant rise to rank 51 in July. This upward trajectory in July aligns with a substantial increase in sales, indicating a positive market response. In comparison, Hudson Cannabis consistently outperformed Super Dope, maintaining a higher rank throughout the period, although it experienced a slight decline from rank 29 in April to rank 54 in July. Meanwhile, Harney Brothers Cannabis showed a remarkable improvement, climbing from rank 96 in April to surpass Super Dope at rank 48 in July, reflecting a strong growth trend. House of Sacci and High Falls Canna New York maintained relatively stable positions, with House of Sacci slightly declining and High Falls Canna New York showing a minor drop in rank by July. These dynamics highlight the competitive pressures Super Dope faces, emphasizing the need for strategic initiatives to maintain its upward momentum in the New York Flower market.
Notable Products
In July 2025, Cherry Poppers (7g) emerged as the top-performing product for Super Dope, climbing from a consistent fourth-place position in April and May to first place with sales reaching 505 units. Plum Popperz (7g) made a significant debut, securing the second rank with 408 units sold, indicating strong consumer interest. Bubblegum Popperz (3.5g) and Bubblegum Popperz (7g) followed closely, taking the third and fourth ranks respectively, showcasing a preference for the Bubblegum flavor in different sizes. Mega Z (7g) remained steady at the fifth position, maintaining consistent sales performance over the past few months. This shift in rankings suggests a growing popularity of the new Popperz variants among consumers.
```Top Selling Cannabis Brands
Data for this report comes from real-time sales reporting by participating cannabis retailers via their point-of-sale systems, which are linked up with Headset’s business intelligence software. Headset’s data is very reliable, as it comes digitally direct from our partner retailers. However, the potential does exist for misreporting in the instance of duplicates, incorrectly classified products, inaccurate entry of products into point-of-sale systems, or even simple human error at the point of purchase. Thus, there is a slight margin of error to consider. Brands listed on this page are ranked in the top twenty within the market and product category by total retail sales volume.

