Jun-2026
Sales
Trend
6-Month
Product Count
SKUs
Avg Price
YoY Sales Change
YoY Price Change
Market Insights Snapshot
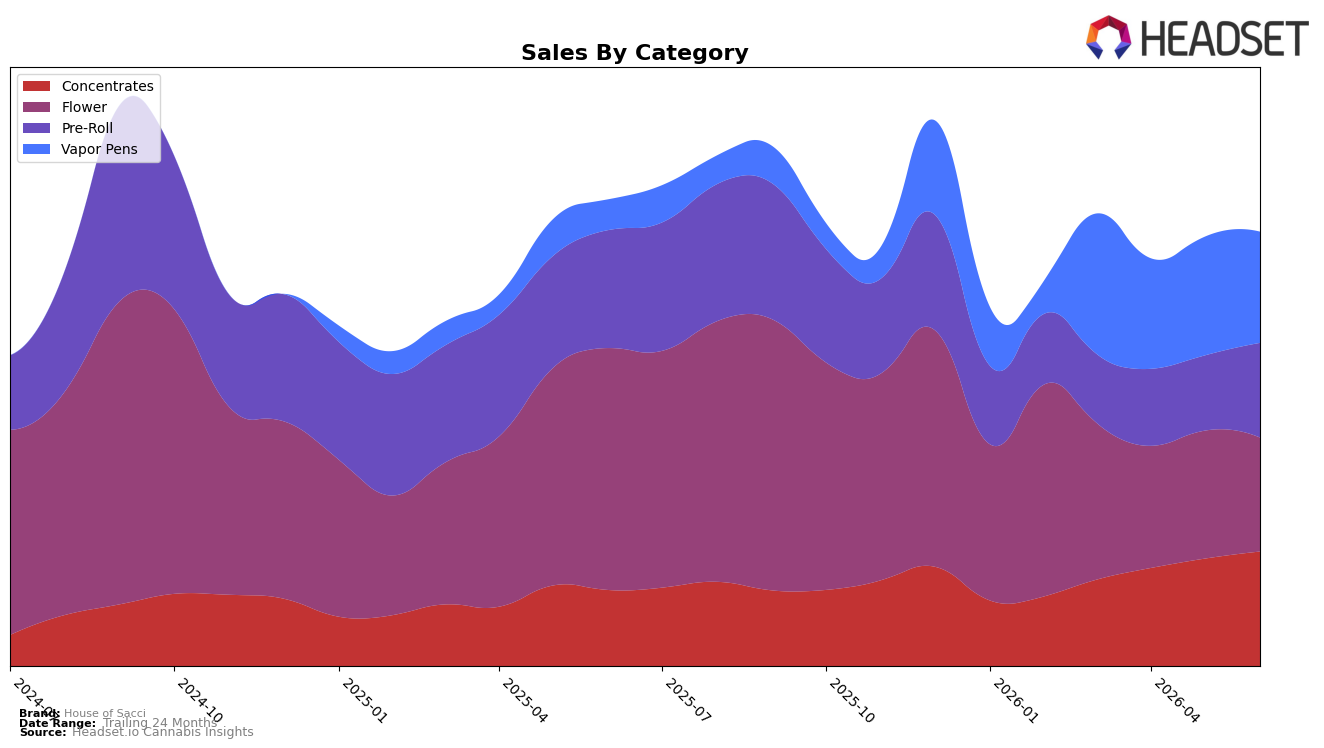
June 2026 category mix shows House of Sacci split almost evenly across Concentrates at 26.36% share and Flower at 26.24% share, with Vapor Pens close behind at 25.61% and Pre-Roll at 21.79%. Year over year, Vapor Pens expanded 263.55% while Flower contracted 52.96%, and month over month, Pre-Roll climbed 25.99% as Flower fell 10.96%. Average prices compressed 27.91% YoY at the brand level alongside a 6.63% MoM lift in Concentrates and a 6.30% MoM dip in Vapor Pens, indicating a shift toward lower-priced volume while premium Concentrates still gained pace. The pattern implies a deliberate reweighting from legacy Flower into higher-velocity formats—Vapor Pens on a YoY basis and Pre-Roll MoM—while protecting a foothold in Concentrates where the brand holds rank 10 in New York.
With Concentrates up 50.78% YoY and Vapor Pens up 263.55% YoY against a 6.95% YoY brand sales decline, category gains are offsetting weakness concentrated in Flower’s 52.96% YoY drop and the 10.96% MoM decline, suggesting portfolio repositioning rather than broad demand loss. The June 2026 mix—three categories clustered within 0.75–0.99 percentage points of each other in share—reduces concentration risk while leveraging Pre-Roll’s 25.99% MoM surge to stabilize near-term sell-through. This balance, combined with a rank position of 10 in Concentrates in New York, implies the brand is migrating toward inhalable convenience and extract-led loyalty to defend pricing power despite an overall 27.91% YoY average price drop.
Competitive Landscape
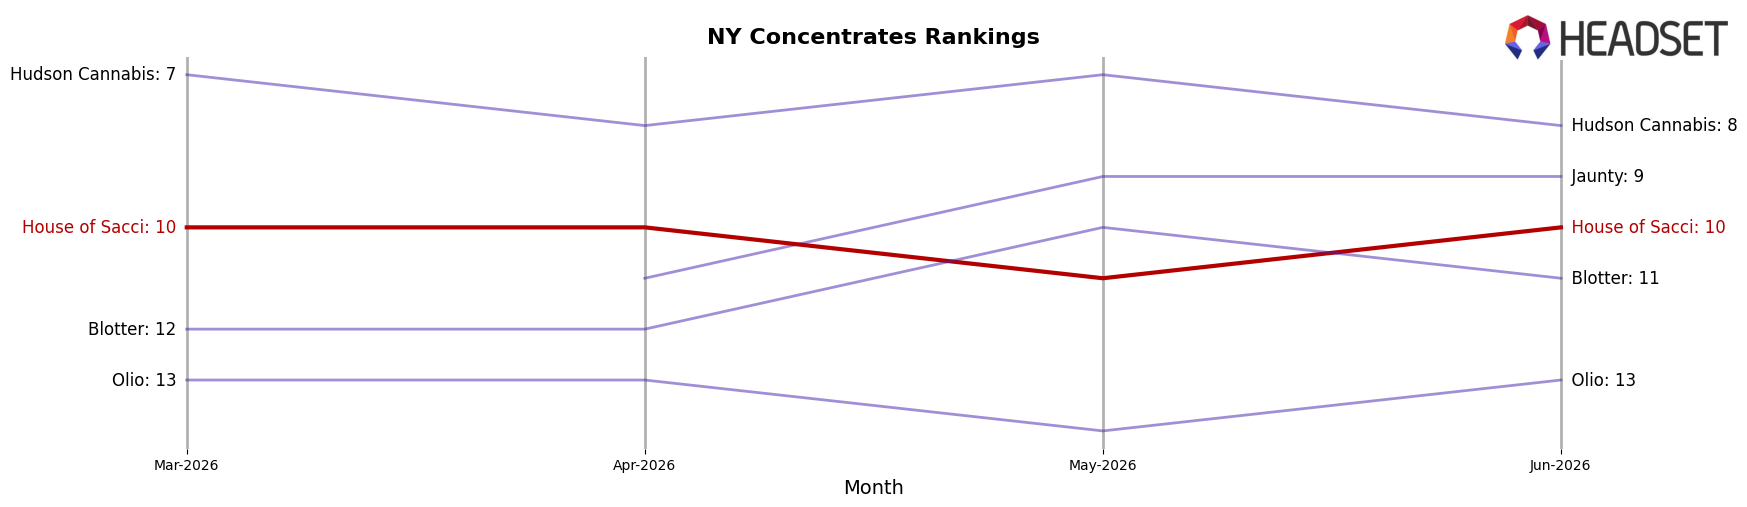
House of Sacci sits at rank #10 in New York Concentrates in June 2026, a 4-place climb from #14 year over year, and it matches its 3-month position at #10 while reaching its peak rank this month. In contrast, Mfny (Marijuana Farms New York) held #1 both year over year and in June 2026 as its sales expanded 70.1%, and UMAMII surged from #26 to #3 with a 1,648.3% sales increase, indicating that upward mobility is possible but concentrated among a few fast risers. With Jetpacks improving from #4 to #2 alongside 61.8% sales growth while House of Sacci remains at #10 with a 0-place change versus March 2026 and a 4-rank YoY gain, the pattern implies House of Sacci is stabilizing at the edge of the top 10 rather than breaking into the top tier without a step-change catalyst.
Notable Products
Laughing Gas Distillate Cartridge (1g) led June 2026 with an 87.97% month-over-month surge to rank 1, while Tropic Cherry (3.5g) fell 22.57% to rank 3, indicating a pivot from Flower to Vapor Pens at the top of the chart. Vapor Pens placed three SKUs in the top ten with ranks 1, 4, and 10, and Maui Waui Distillate Cartridge (1g) added a 26.63% lift at rank 4, whereas Concentrates mixed results with Blonde Hash (1g) up 6.63% at rank 2 but Indica Brown Solventless Hash (1g) down 4.43% at rank 6. With Pre-Rolls at ranks 7 and 9 posting modest gains of 4.80% and 13.67% respectively, the product mix implies House of Sacci is concentrating demand in inhalables where Vapor Pens are accelerating faster than Flower and edging out slower-moving Concentrates.
Top Selling Cannabis Brands
Data for this report comes from real-time sales reporting by participating cannabis retailers via their point-of-sale systems, which are linked up with Headset’s business intelligence software. Headset’s data is very reliable, as it comes digitally direct from our partner retailers. However, the potential does exist for misreporting in the instance of duplicates, incorrectly classified products, inaccurate entry of products into point-of-sale systems, or even simple human error at the point of purchase. Thus, there is a slight margin of error to consider. Brands listed on this page are ranked in the top twenty within the market and product category by total retail sales volume.

