.svg)



Where to Buy
Sweet Stone is stocked at 22 licensed dispensaries across Missouri, with the deepest coverage in St. Louis, Kansas City, Columbia, Bridgeton, and Cassville. Search by ZIP code or city below to find the closest one.
Market Insights Snapshot
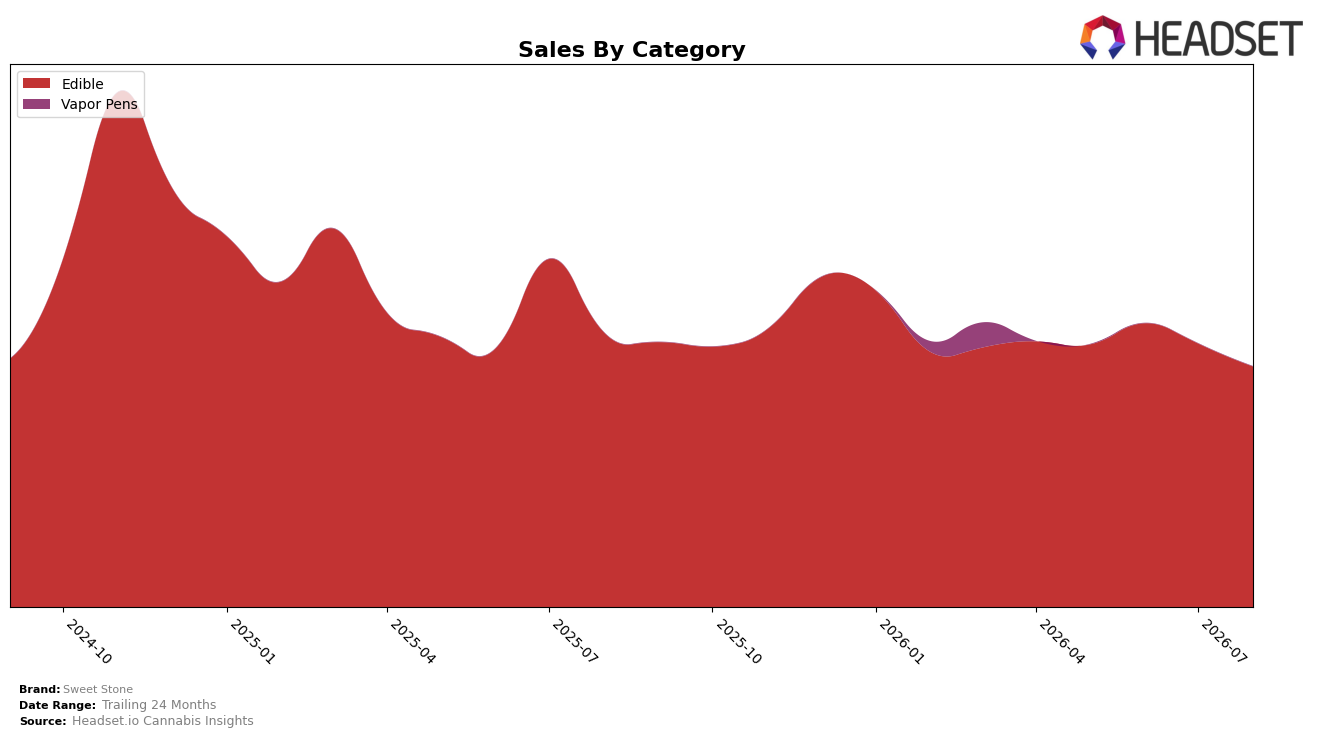
In August 2026, Sweet Stone operated as a single-category brand with Edible representing 100.0% of sales, concentrating all volume in one segment while brand sales declined 12.45% year over year and 8.77% month over month. Average price fell 7.81% YoY to $17.05, indicating price compression coinciding with share immobility at 100.0% and a category rank of 48 within Missouri Edible. The pattern implies a reliance on Edible that amplifies exposure to category headwinds, where price cuts are not offsetting volume softness, constraining momentum and rank improvement.
With a 40.31% sales decline over 24 months and a 12.45% YoY contraction concentrated entirely in Edible, the brand’s positioning skews toward depth over breadth, but the 8.77% MoM dip and rank 48 suggest limited defensive capacity against demand volatility. The 7.81% YoY price reduction alongside unchanged category breadth (100.0% Edible) points to a value-seeking stance that is not converting into market share gains, implying Sweet Stone needs either premiumization within Edible or adjacent-category entry to reduce sensitivity to Edible-specific pricing and velocity swings.
Competitive Landscape
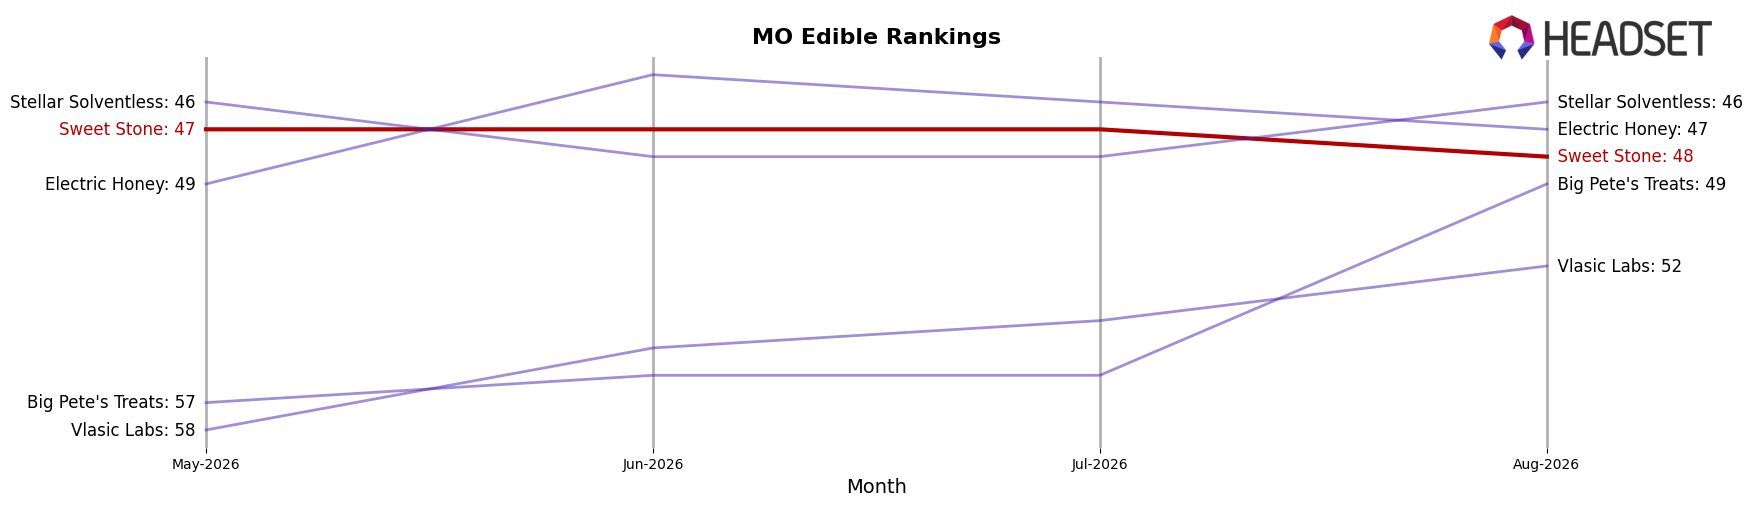
Sweet Stone sits at rank #48 in MO Edible for August 2026, down 2 positions year over year from #46 and 1 position since three months ago from #47, while still trailing its peak of #37 from October 2024; in contrast, Good Day Farm climbed to #1 from #2 with a 5.41% YoY sales increase and Gron / Grön slipped from #1 to #2 with a -7.83% YoY sales change, indicating leaders are consolidating share as Good Taste rose from #8 to #5 on 34.59% YoY growth while Wyld held #3 despite a -10.75% YoY decline; the pattern implies Sweet Stone’s downward drift and distance from its #37 peak are less about broad category contraction and more about losing relative velocity to competitors moving up the rankings.
Notable Products
Sativa Sour Strawberry Gummies 10-Pack (100mg) delivered the largest month-over-month gain at +103.5% to rank 3, while Peanut Butter Cookies 10-Pack (100mg) surged even faster at +192.7% to rank 2, indicating momentum is consolidating in just two fast-rising SKUs. By contrast, Sativa Pineapple Gummies 10-Pack (100mg) fell -53.6% to rank 7 and Miami Vice - Strawberry Pina Colada Gummies 10-Pack (200mg) dropped -30.7% to rank 4, while the long-time leader CBD/THC/CBN 1:1:1 Blackberry Honey Night Time Gummies 10-Pack (100mg CBD, 100mg THC, 100mg CBN) inched up only +4.1% at rank 1, pointing to a reshuffle beneath the top spot. Eight of the top ten are Edible SKUs, and the cookies-plus-fruit gummy mix suggests August 2026 demand is tilting toward familiar flavors over niche variants, with scale coming from a few breakout movers rather than a broad lift. The pattern implies Sweet Stone’s commercial direction should prioritize the two accelerating winners while pruning underperforming fruity extensions to concentrate spend where velocity is compounding.
Top Selling Cannabis Brands






Data for this report comes from real-time sales reporting by participating cannabis retailers via their point-of-sale systems, which are linked up with Headset’s business intelligence software. Headset’s data is very reliable, as it comes digitally direct from our partner retailers. However, the potential does exist for misreporting in the instance of duplicates, incorrectly classified products, inaccurate entry of products into point-of-sale systems, or even simple human error at the point of purchase. Thus, there is a slight margin of error to consider. Brands listed on this page are ranked in the top twenty within the market and product category by total retail sales volume.

