Jun-2026
Sales
Trend
6-Month
Product Count
SKUs
Avg Price
YoY Sales Change
YoY Price Change
Market Insights Snapshot
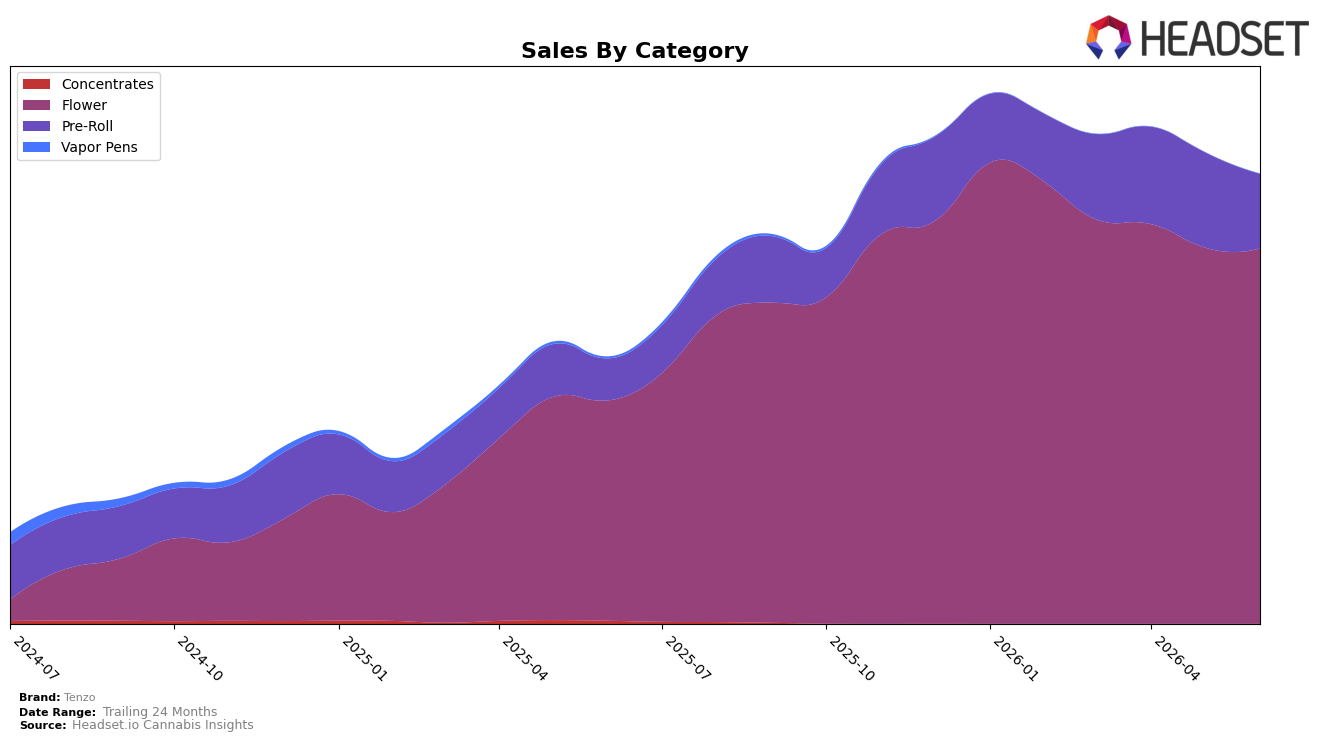
In June 2026, Tenzo’s mix concentrated in Flower at 83.48% share with year-over-year growth of 70.45% and a marginal month-over-month dip of 0.25%, while Pre-Roll held 16.52% share with faster year-over-year growth of 78.74% but a sharper month-over-month decline of 21.85%. Brand-level sales grew 68.74% year over year alongside a 13.76% decrease in average price, implying that unit volume expanded materially as pricing eased; the category skew toward Flower paired with Pre-Roll’s steeper month-over-month pullback suggests the portfolio leaned on core Flower velocity to offset short-term Pre-Roll softness.
Tenzo’s Flower rank of 12 in Ontario within Flower, combined with an 83.48% category share and a 0.25% month-over-month decline versus a 21.85% Pre-Roll decline, implies resilience in core positioning where the brand competes most frequently. The 13.76% average price decrease alongside 70.45% Flower growth and 78.74% Pre-Roll growth year over year indicates a price-to-volume trade that strengthened accessibility while maintaining high-category concentration, implying that Tenzo’s near-term positioning benefits from reinforcing Flower leadership rather than expanding mix breadth.
Competitive Landscape
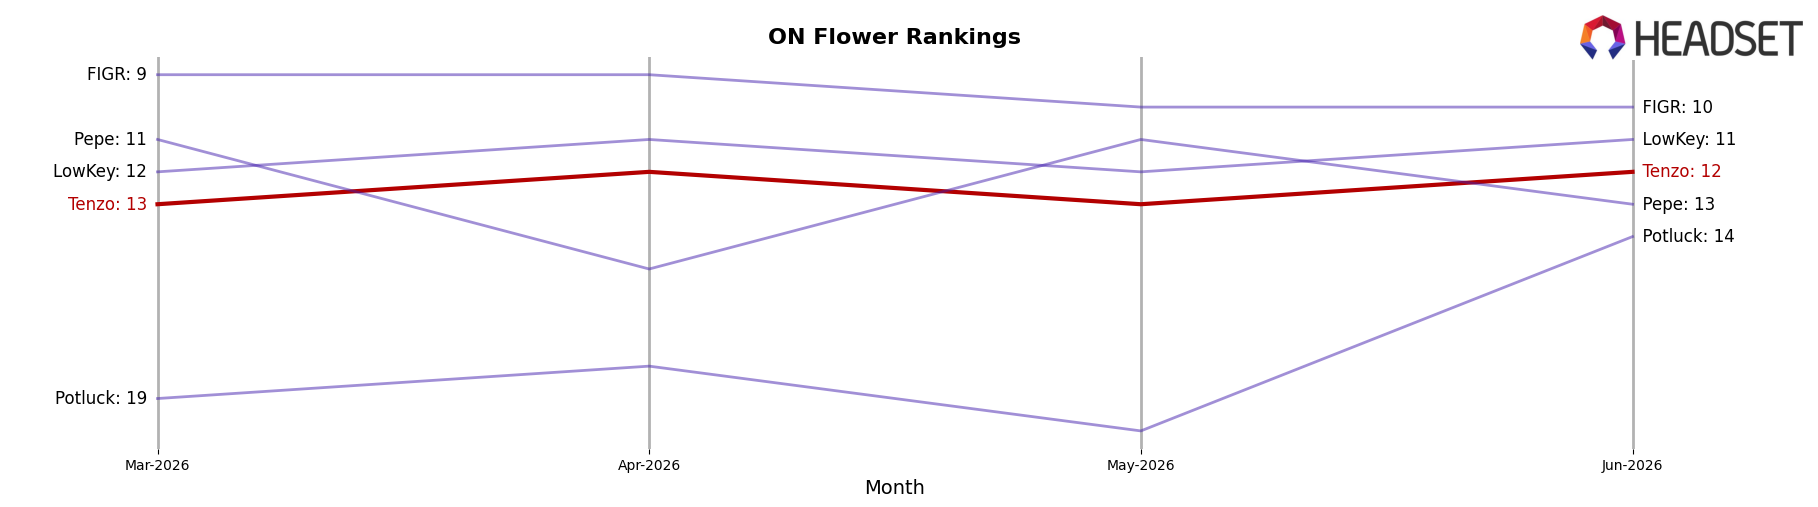
Tenzo ranks #12 in ON Flower in June 2026, improving 13 positions from #25 year over year, and edging up 1 spot from #13 in March 2026 while still trailing its peak of #10 reached in February 2026; meanwhile, competitor Spinach climbed from #4 to #1 with 38.28% year-over-year sales growth, and Back Forty / Back 40 Cannabis slipped from #1 to #4 with an 11.25% decline, indicating Tenzo’s mid‑tier ascent is occurring amid share consolidation at the top. With Shred steady at #2 on 18.48% growth and The Original Fraser Valley Weed Co. rising from #8 to #5 on 26.53% growth, the competitive ladder is tightening above Tenzo’s current #12, implying that sustaining double‑digit rank gains will require either displacing softening incumbents like Back Forty or outpacing growth leaders such as Spinach and Shred to convert February 2026’s #10 proximity into durable top‑10 placement.
Notable Products
Tenzo's steepest movement in June 2026 was the decline of Pink Passionfruit & Peach Infused Pre-Roll (0.5g), down 12.1% month over month at rank 2, while category leader Fun Trip Milled (7g) at rank 1 fell 15.5% and Sweet Dreams (7g) at rank 5 slid 18.9%. With four of the top ten coming from Flower and two large 14g value packs moving in opposite directions — Big Smallz (14g) down 16.5% at rank 6 and Biggie Smalls (14g) up 5.5% at rank 9 — shoppers are polarizing between premium milled formats and selective value picks. Only one pre-roll in the top eight posted a gain, Red Bottoms Distillate Infused Pre-Roll (0.5g) up 1.0% at rank 8, while Midnight Maraschino Infused Pre-Roll (1g) dropped 15.7% at rank 7, implying mix pressure inside Pre-Roll as flavor-led SKUs fragment demand. The pattern points to a shift toward Flower-led baskets anchored by milled convenience and selective 14g value, with Pre-Roll needing tighter SKU focus rather than breadth.
Top Selling Cannabis Brands
Data for this report comes from real-time sales reporting by participating cannabis retailers via their point-of-sale systems, which are linked up with Headset’s business intelligence software. Headset’s data is very reliable, as it comes digitally direct from our partner retailers. However, the potential does exist for misreporting in the instance of duplicates, incorrectly classified products, inaccurate entry of products into point-of-sale systems, or even simple human error at the point of purchase. Thus, there is a slight margin of error to consider. Brands listed on this page are ranked in the top twenty within the market and product category by total retail sales volume.

