.svg)

Aug-2026
Sales
Trend
6-Month
Product Count
SKUs
Avg Price
YoY Sales Change
YoY Price Change


Market Insights Snapshot
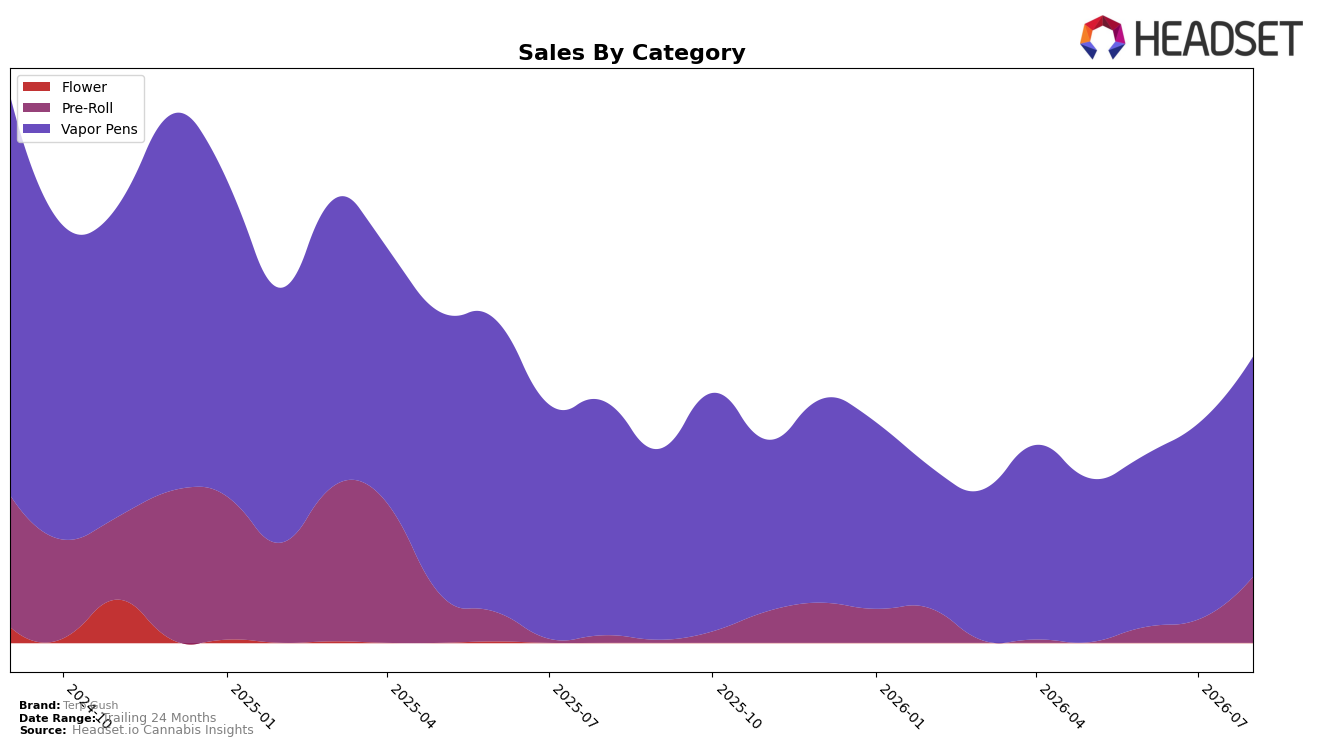
In August 2026, Terp Gush concentrated 76.98% of sales in Vapor Pens while Pre-Roll expanded to 23.02% share, indicating a sharp rebalancing of the mix. Vapor Pens fell 5.94% year over year yet rose 12.45% month over month, whereas Pre-Roll surged 809.05% year over year and accelerated 187.21% month over month; paired with a 50.00% year-over-year drop in average price, this indicates volume-led recovery rather than price-led gains. With Vapor Pens ranked 58 in Ontario and the brand’s total sales up 18.52% year over year against a 54.76% decline over 24 months, the pattern implies a pivot where rapid Pre-Roll adoption is offsetting legacy Vapor Pen softness while near-term momentum depends on sustaining mix-driven volume growth.
The mix shift carries positioning implications: Vapor Pens remain the anchor at 76.98% share and a 12.45% month-over-month lift, but the 5.94% year-over-year decline alongside a 58th-place rank pressures premium signaling, while Pre-Roll’s 809.05% year-over-year and 187.21% month-over-month gains reframe Terp Gush toward value-accessible entry points enabled by a 50.00% lower average price. In Ontario, this configuration suggests defending Vapor Pen visibility while leveraging Pre-Roll velocity to climb from rank 58, implying that near-term share gains will come from depth in Pre-Roll and price-pack architecture even as Vapor Pens set the ceiling for category stature.
Competitive Landscape
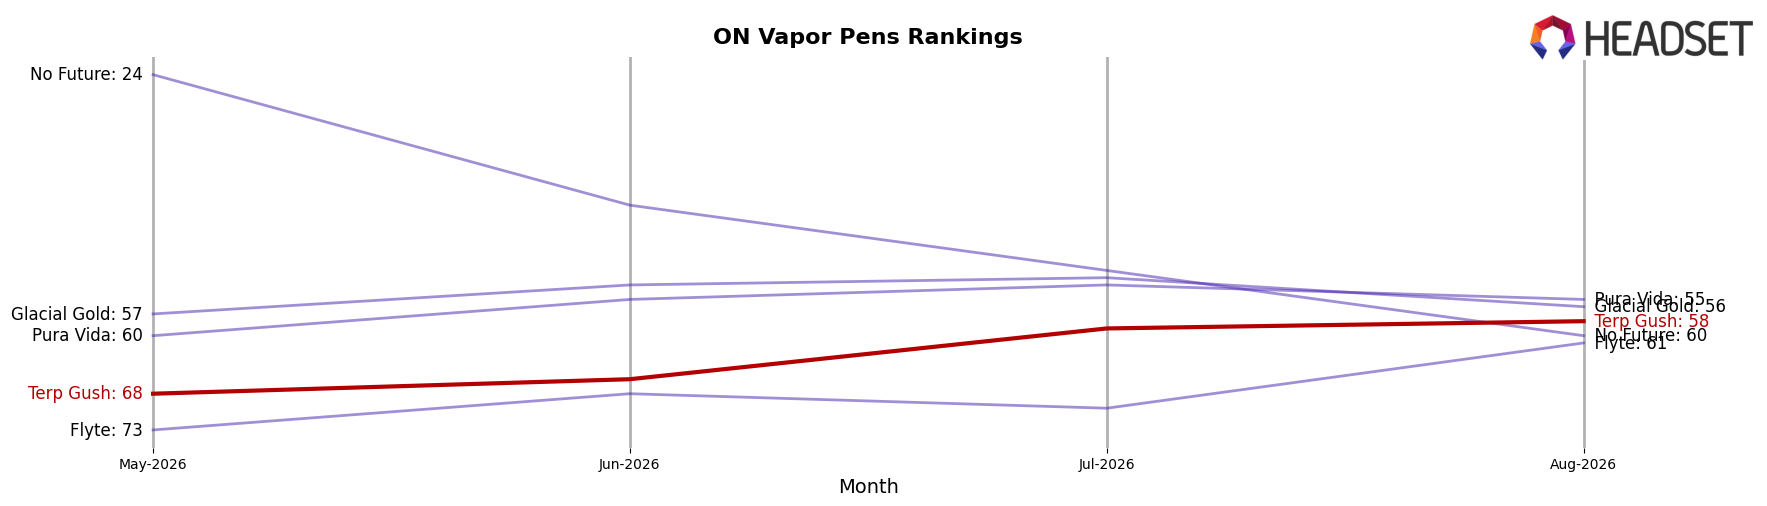
Terp Gush sits at rank #58 in ON Vapor Pens in August 2026, improving 2 positions YoY from #60 and climbing 10 spots since May 2026 from #68, while remaining 18 places below its peak of #40 set in August 2024; in contrast, Spinach advanced from #4 to #1 and Jays (Canada) jumped from #17 to #5, indicating that category share is consolidating at the top as leaders outpace mid-tier movers. Compared with three-month momentum, the 10-rank rise since May 2026 coexists with a longer-term two-year slide from August 2024’s #40, whereas BoxHot edged up from #2 to #3 and General Admission slipped from #3 to #4 with a -16.7% YoY sales change, implying Terp Gush’s recent uptick is recovery within the lower tier rather than a breakthrough into the consolidating top five, and the trajectory points to incremental gains unless distribution or product mix shifts materially from current positioning and price points near a single mid-tier SKU average of $32.
Notable Products
Raspberry Guava GLTO Infused Pre-Roll 3-Pack (1.5g) posted a +187% month-over-month surge to rank 1 in August 2026, overtaking Vapor Pens that previously held the top spots, which implies a pivot toward infused pre-roll demand over incremental pen gains. Frosted Swirl Live Resin Cartridge (1g) held rank 2 with just +3.7% MoM while Lemon Fantasy Live Resin Cartridge (1g) rose +47% MoM at rank 3, and two of the top three remain Vapor Pens, signaling a split where pens anchor share but pre-rolls capture momentum. With Vapor Pens comprising two of the top three, the mix indicates a strategy to defend pen leadership while leaning into higher-velocity infused formats to diversify basket drivers.
Top Selling Cannabis Brands






Data for this report comes from real-time sales reporting by participating cannabis retailers via their point-of-sale systems, which are linked up with Headset’s business intelligence software. Headset’s data is very reliable, as it comes digitally direct from our partner retailers. However, the potential does exist for misreporting in the instance of duplicates, incorrectly classified products, inaccurate entry of products into point-of-sale systems, or even simple human error at the point of purchase. Thus, there is a slight margin of error to consider. Brands listed on this page are ranked in the top twenty within the market and product category by total retail sales volume.

