Jan-2026
Sales
Trend
6-Month
Product Count
SKUs
Avg Price
YoY Sales Change
YoY Price Change
Market Insights Snapshot
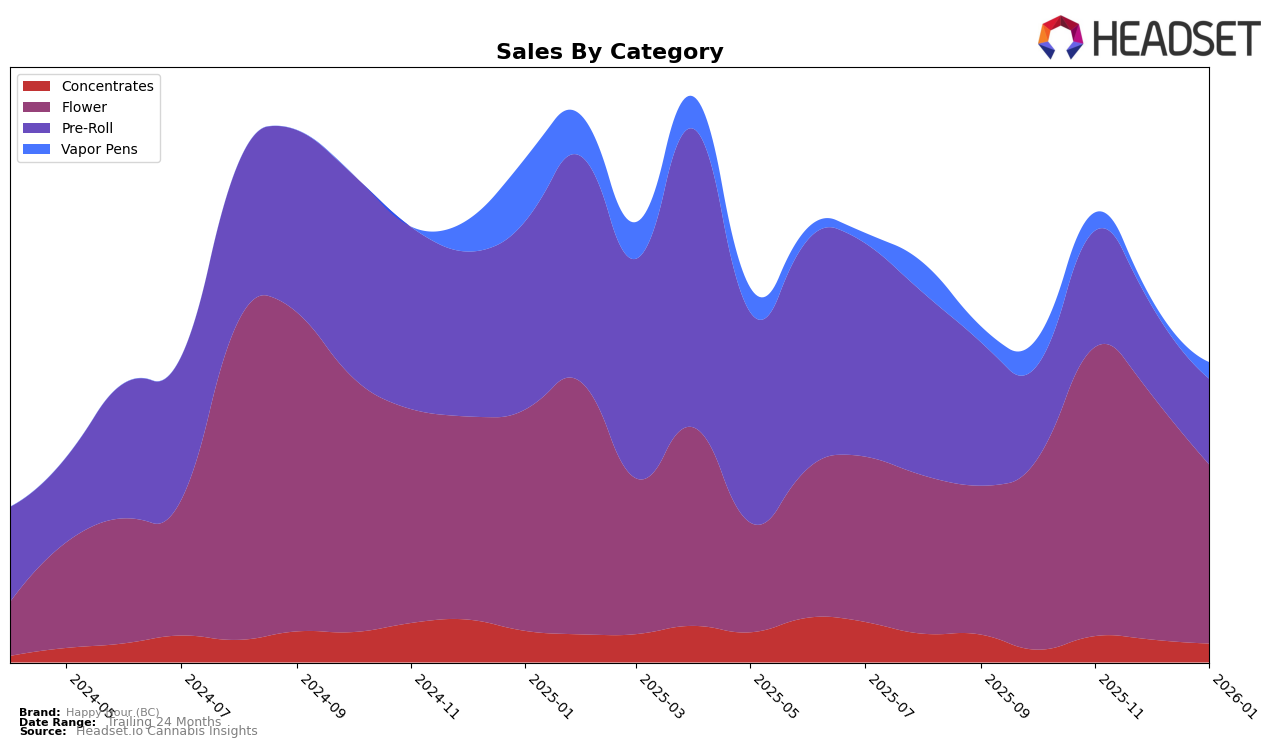
In the British Columbia market, Happy Hour (BC) has shown a noteworthy performance in the Concentrates category. The brand moved up from rank 33 in October 2025 to rank 28 by January 2026, indicating a gradual but positive upward trend. This improvement is mirrored by a substantial increase in sales from October to November, although there was a slight decline in subsequent months. It's interesting to note that while they managed to break into the top 30 for Concentrates, their performance in the Vapor Pens category was less impressive, with the brand failing to maintain a presence in the top 30 for December 2025.
Happy Hour (BC) experienced contrasting fortunes in the Flower and Pre-Roll categories in British Columbia. In the Flower category, the brand's rank declined from 16 in October 2025 to 30 by January 2026, indicating potential challenges in maintaining its earlier momentum. Meanwhile, the Pre-Roll category saw an even more significant drop, with the brand never breaking into the top 30 during the observed period. This suggests that while Happy Hour (BC) has certain strengths, particularly in Concentrates, it faces competitive pressures and potential areas for improvement in other product categories.
Competitive Landscape
In the competitive landscape of the Flower category in British Columbia, Happy Hour (BC) has experienced a notable decline in rank from October 2025 to January 2026, dropping from 16th to 30th position. This shift is particularly significant when compared to competitors like Redecan and Tribal, both of which maintained a presence in the top 30 throughout the same period. Notably, Good Buds demonstrated a remarkable upward trajectory, climbing from 86th to 32nd, suggesting a strong increase in consumer preference or strategic market positioning. Meanwhile, Simply Bare showed consistent performance, hovering around the mid-30s rank. The decline in Happy Hour (BC)'s rank could be attributed to the aggressive growth strategies of these competitors, indicating a need for Happy Hour (BC) to reassess its market approach to regain its competitive edge in the Flower category.

Notable Products
In January 2026, the top-performing product from Happy Hour (BC) was Harmony Haze Pre-Roll (0.5g) in the Pre-Roll category, maintaining its number one ranking from the previous two months with sales of 4887 units. Nighttime Nirvana Pre-Roll (0.5g) consistently held the second position for four consecutive months. Sativa Pre-Roll 2-Pack (2g) remained stable in third place, though its sales slightly decreased compared to December 2025. Midday Mix - Gastro Pop Pre-Roll (0.5g) improved to fourth place after a dip in December, showing resilience in its sales performance. A new entry, Midday Mix - Gelato Pre-Roll (0.5g), debuted in the rankings at fifth place, indicating a strong market entry.
Top Selling Cannabis Brands
Data for this report comes from real-time sales reporting by participating cannabis retailers via their point-of-sale systems, which are linked up with Headset’s business intelligence software. Headset’s data is very reliable, as it comes digitally direct from our partner retailers. However, the potential does exist for misreporting in the instance of duplicates, incorrectly classified products, inaccurate entry of products into point-of-sale systems, or even simple human error at the point of purchase. Thus, there is a slight margin of error to consider. Brands listed on this page are ranked in the top twenty within the market and product category by total retail sales volume.

