.svg)

Sep-2026
Sales
Trend
6-Month
Product Count
SKUs
Avg Price
YoY Sales Change
YoY Price Change


Where to Buy
The Blues Brothers is stocked at 160 licensed dispensaries across Mississippi, New Jersey, and 6 other states, 54 of them in Mississippi, with the deepest coverage in Hattiesburg, Jackson, Ocean Springs, Oxford, and Biloxi. Search by ZIP code or city below to find the closest one, or filter by product type if you are after a specific format.
Market Insights Snapshot
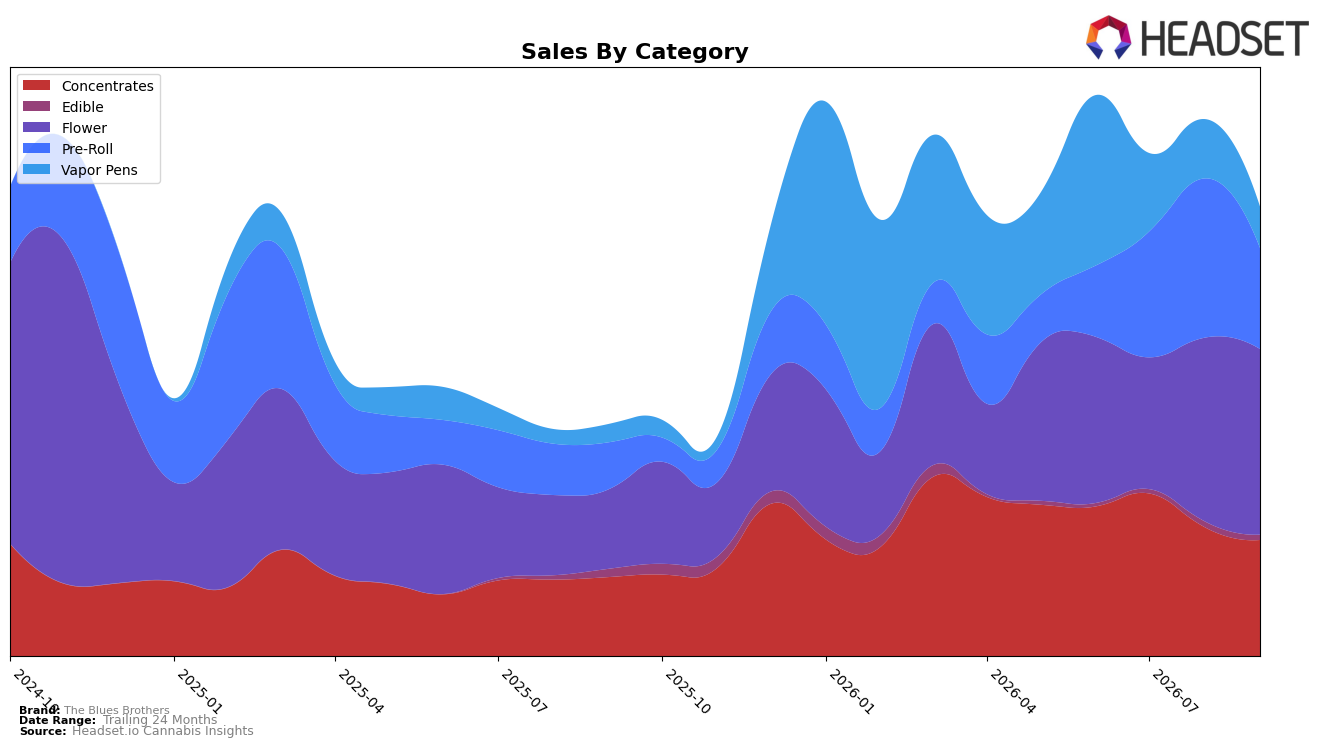
In September 2026, The Blues Brothers leaned into Flower at 41.34% share with 134.46% year-over-year growth and a 1.11% month-over-month lift, while Pre-Roll held 22.47% share with 115.26% YoY but fell 36.63% MoM; Concentrates contributed 25.91% share with 46.94% YoY and a 9.95% MoM decline. Vapor Pens sat at 9.17% share with 128.43% YoY despite a 30.37% MoM drop, and Edible was 1.12% share with a 36.52% YoY decline and 9.11% MoM contraction. With brand-level sales up 94.26% YoY and average price down 5.46% YoY, the pattern implies the brand is consolidating volume in Flower and price-accessible formats while cycling volatility in inhalables month to month.
The mix shift suggests a repositioning toward a Flower-led identity that benefits from price elasticity at a $29.28 average Flower price and traffic capture from Pre-Roll despite its 36.63% MoM pullback, indicating basket-building anchored by inhalable value. The 128.43% YoY in Vapor Pens alongside a 30.37% MoM decline implies episodic promotional or inventory-driven spikes, while Edible’s 36.52% YoY contraction and 1.12% share signal deprioritization that narrows the portfolio to categories where scale effects can offset a 5.46% YoY average price decrease. Holding a Flower rank of 56 in Maryland with New Jersey as the top state concentrates the brand’s positioning on core inhalables, implying that sustained gains will come from stabilizing Pre-Roll and Vapor Pens MoM swings while defending Flower share above 40%.
Competitive Landscape
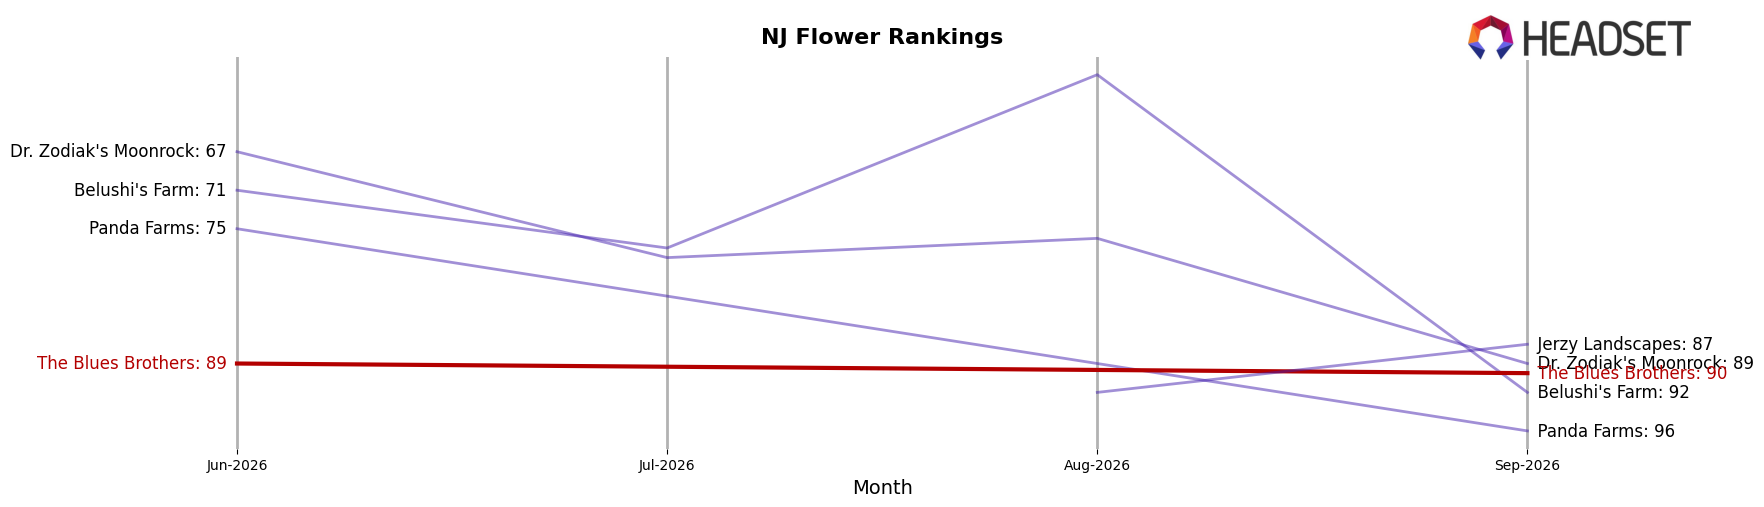
The Blues Brothers sits at rank #90 in NJ Flower in September 2026 with a 1-place decline from #89 in June 2026, and a current-to-peak spread of just 1 rank suggests limited upward momentum; meanwhile, Find. advanced to #1 from #6 year over year with 111.6% sales growth, and Good Green moved to #3 from #17 with 166.7% sales growth, contrasting with RYTHM sliding to #4 from #3 alongside a 9.8% sales decline—this mix of rapid ascents and selective pullbacks implies The Blues Brothers’ flat-to-down rank trajectory is at risk of further slippage unless it captures share from rising leaders.
Notable Products
Cadillac Rainbow Pre-Roll (0.5g) posted the steepest decline in September 2026, dropping 71.5% MoM to rank 7, while Santa Cruz Blue Dream Pre-Roll 2-Pack (1g) fell 54.4% to rank 6, signaling acute contraction in Pre-Rolls where four of the top ten are Pre-Roll SKUs. In contrast, Mule Fuel (3.5g) rose 40.0% MoM to hold rank 1 and captured the brand’s only dollar highlight at $46,747, as Sativa Brick Hash (1g) slid 50.2% MoM to rank 9, indicating divergence between Flower stability and Extract volatility. The pattern implies The Blues Brothers is leaning on a single Flower leader while Pre-Roll and Concentrates retrench, pointing commercial focus toward reinforcing Flower while triaging underperforming format lines.
Top Selling Cannabis Brands






Data for this report comes from real-time sales reporting by participating cannabis retailers via their point-of-sale systems, which are linked up with Headset’s business intelligence software. Headset’s data is very reliable, as it comes digitally direct from our partner retailers. However, the potential does exist for misreporting in the instance of duplicates, incorrectly classified products, inaccurate entry of products into point-of-sale systems, or even simple human error at the point of purchase. Thus, there is a slight margin of error to consider. Brands listed on this page are ranked in the top twenty within the market and product category by total retail sales volume.

