.svg)


Market Insights Snapshot
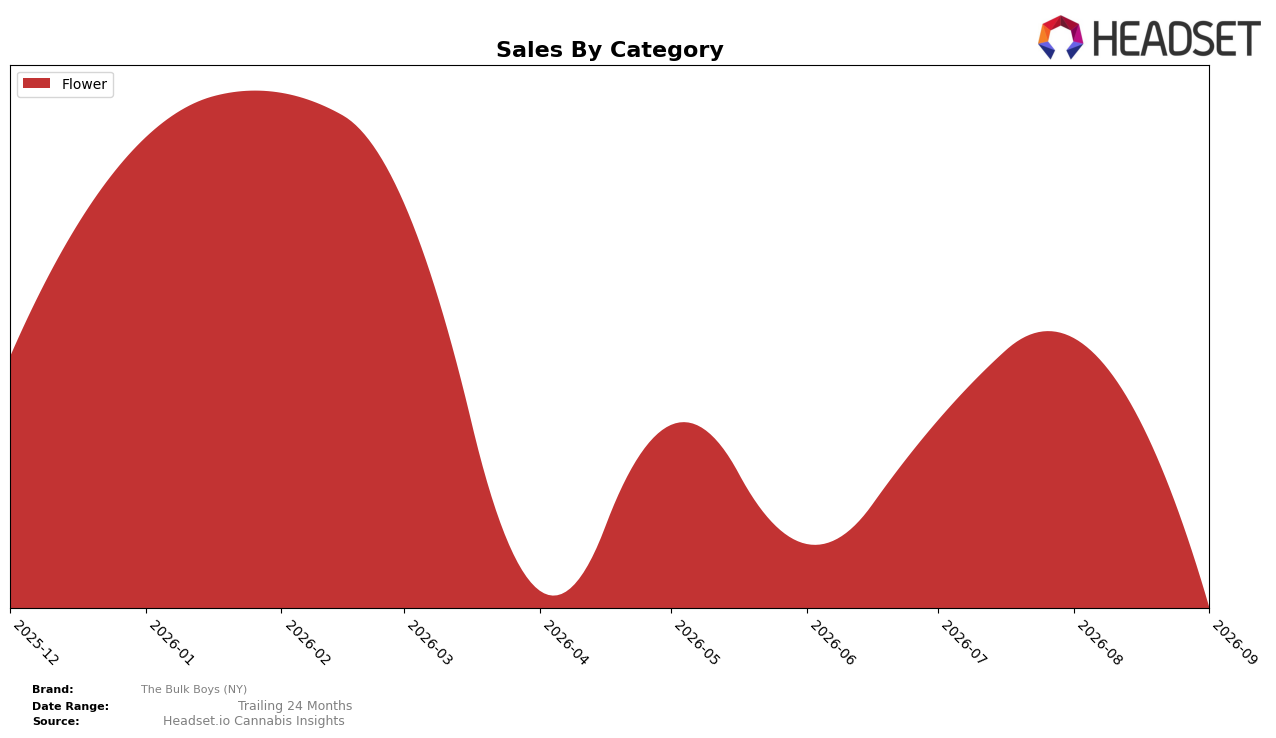
In September 2026, The Bulk Boys (NY) operated as a single-category brand with Flower at 100.0% of sales share, and average price at $111.03. Within this mono-lineup, month-over-month Flower sales contracted by 40.70%, while category share remained at 100.0%, indicating concentration rather than diversification. The fully concentrated mix and a 40.70% monthly drop together imply exposure to single-category volatility, where any demand or pricing shock in Flower directly translates into overall brand movement.
Position-wise in New York Flower, The Bulk Boys (NY) held rank 35, pairing a mid-pack placement with a 100.0% reliance on Flower and a 40.70% monthly slide. With no offset from Vapor Pens, Pre-Rolls, or Edibles, the brand’s risk profile is elevated: a single channel must carry both price ($111.03 average) and volume outcomes. The combination of rank 35 and a 40.70% MoM decline implies that retention and velocity improvements must come from Flower SKU optimization and price-pack architecture, because the absence of category ballast limits defensive levers if September 2026 category tides turn against Flower.
Competitive Landscape
The Bulk Boys (NY) sits at rank #35 in NY Flower for September 2026, down 3 spots from #32 in June 2026, and 22 places below its peak at #13 in February 2026; with no year-over-year rank available, the three-month slide contrasts with Find. holding #1 while improving 5 ranks year over year and with Grassroots advancing to #2 with a 15-rank YoY climb and 150.33% sales growth, implying The Bulk Boys (NY) needs to arrest mid-year share erosion as faster-rising incumbents consolidate the top tier.

Notable Products
LA Confidential (28g) posted the steepest decline in September 2026 at -85.6% and slipped to rank 7, while Headband (28g) fell -71.4% to rank 5; even Tangie (28g) contracted -57.5% yet still held rank 3. The category concentration is pronounced with all top 10 SKUs in Flower, and the top two ranks were retained by Cinderella 99 (28g) at rank 1 despite -48.9% and GMO (28g) at rank 2 with -154.4% indicating a likely stockout or returns reversal. Bulky's Blend of Bits #1 (84g) debuted at rank 9 with no prior MoM baseline, contrasting with Trainwreck (28g) at rank 10 after a -13.9% slide and GG4 (28g) at rank 6 after -30.6%. The pattern implies assortment risk concentrated in large-format Flower where volatility in core eighth/ounce SKUs pressures stability, nudging The Bulk Boys (NY) toward blend-based value packs and tighter SKU rationalization to buffer month-to-month swings.
Top Selling Cannabis Brands






Data for this report comes from real-time sales reporting by participating cannabis retailers via their point-of-sale systems, which are linked up with Headset’s business intelligence software. Headset’s data is very reliable, as it comes digitally direct from our partner retailers. However, the potential does exist for misreporting in the instance of duplicates, incorrectly classified products, inaccurate entry of products into point-of-sale systems, or even simple human error at the point of purchase. Thus, there is a slight margin of error to consider. Brands listed on this page are ranked in the top twenty within the market and product category by total retail sales volume.

