.svg)

Sep-2026
Sales
Trend
6-Month
Product Count
SKUs
Avg Price
YoY Sales Change
YoY Price Change


Market Insights Snapshot
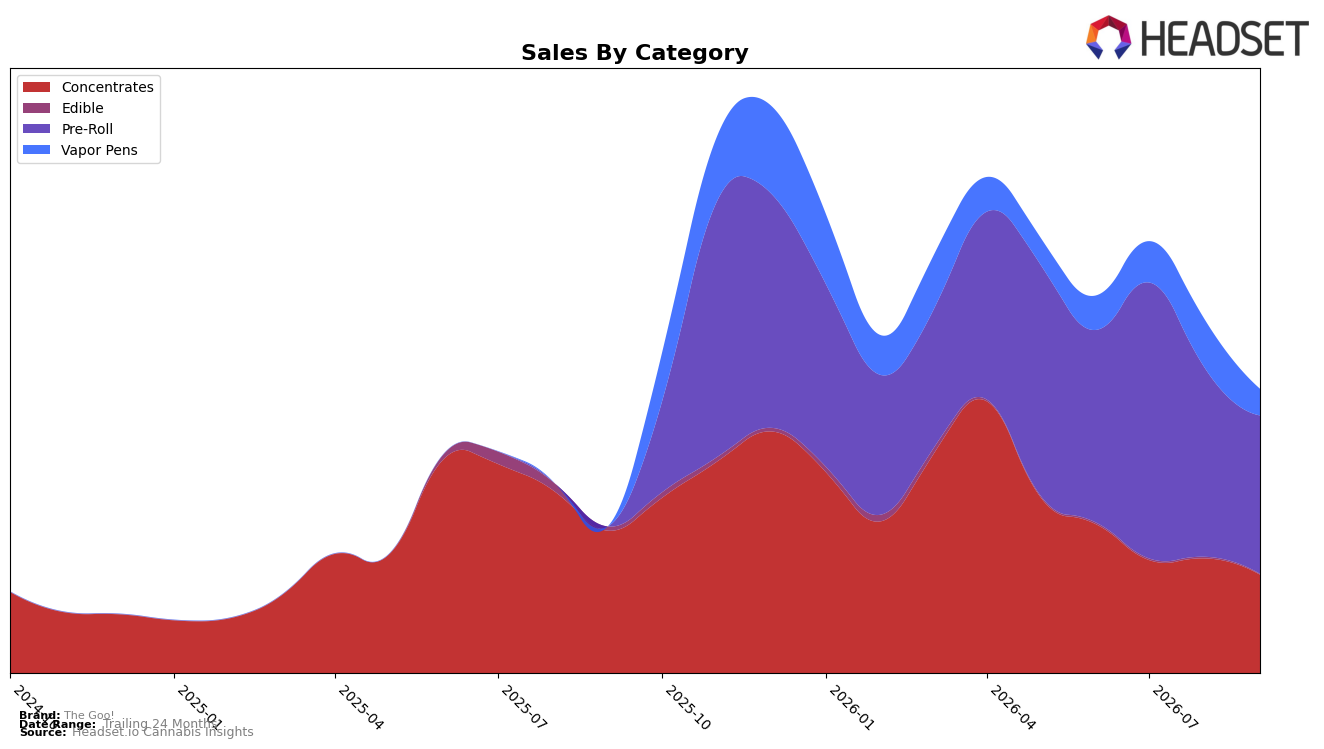
In September 2026, The Goo!'s mix concentrated in Pre-Roll at 55.78% share with a month-over-month decline of 16.24%, while Concentrates held 34.71% share with a 14.20% MoM drop; Vapor Pens accounted for 9.32% share but fell 45.11% MoM, and Edible sat at 0.20% share with an 85.93% YoY decline and 58.36% MoM slide. Despite brand-level sales up 93.78% year over year alongside an 18.24% YoY reduction in average price, category-level pressure is uneven, and the Pre-Roll rank at 65 in Alberta indicates mid-pack placement; the pattern implies that headline growth is being pulled by a few SKUs while the broader portfolio is retrenching in volume-weighted categories.
The widening gap between rising total sales (up 93.78% YoY) and shrinking average price (down 18.24% YoY), combined with a heavier Pre-Roll mix (55.78% share) and sharper volume volatility in Vapor Pens (down 45.11% MoM) and Edible (down 85.93% YoY), implies a value-led repositioning anchored in Pre-Roll. With Concentrates carrying 34.71% share but contracting 14.20% MoM and Pre-Roll sitting at rank 65 in Alberta, the mix shift suggests The Goo! is trading customers into lower-priced Pre-Roll while ceding higher-ticket occasions, which positions the brand for share stability in value tiers but constrains premium headroom unless Vapor Pens and Concentrates recover mix by 5–10 percentage points.
Competitive Landscape
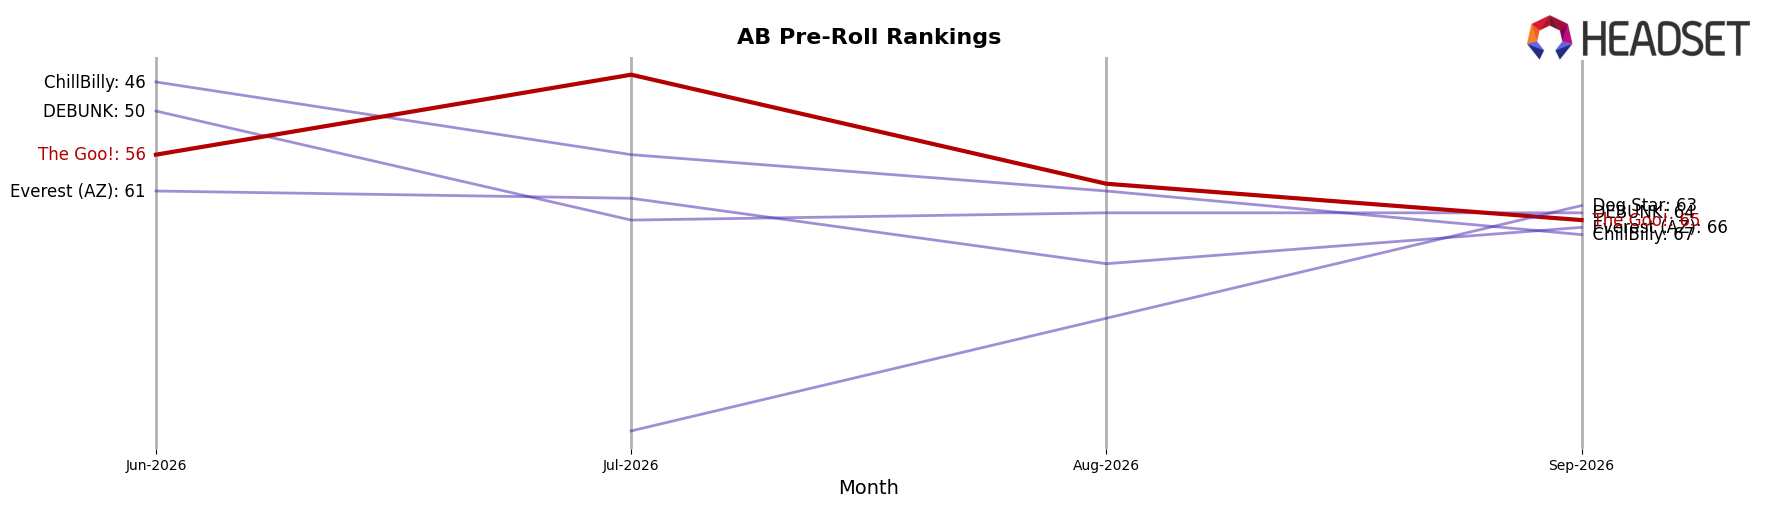
The Goo! sits at #65 in AB Pre-Roll in September 2026, sliding 9 spots from #56 in June 2026 while remaining 23 places below its peak at #42 from November 2025; meanwhile, Back Forty / Back 40 Cannabis holds #1 with a +3 YoY rank movement and +26.2% YoY sales, and General Admission is #2 despite a -1 YoY rank shift and -27.9% YoY sales, indicating that leadership is consolidating even as some top players contract. With The Goo! drifting 9 ranks in three months and now 63 positions behind #2, the pattern implies a downtrend in competitive relevance unless the brand reverses share losses that widened since November 2025.
Notable Products
Goo-Cart Live Rosin Cartridge (0.5g) posted the steepest decline in September 2026 at -46.6% MoM, falling to rank 7, while Brain Fruit Rosin Infused Pre-Roll (1g) slid -48.4% MoM to rank 8. In contrast, It Came From The Kush Live Rosin Infused Pre-Roll 3-Pack (1.5g) rose 35.0% MoM to rank 1 and Brain Fruit Live Rosin Infused Pre-Roll 3-Pack (1.5g) gained 33.2% MoM to rank 4. Five of the top ten are Pre-Roll SKUs, and the category’s mix shift toward multi-pack live rosin formats coincides with vapor pens retrenching, implying The Goo! is consolidating around infused Pre-Rolls while deprioritizing single-pack and pen innovation.
Top Selling Cannabis Brands






Data for this report comes from real-time sales reporting by participating cannabis retailers via their point-of-sale systems, which are linked up with Headset’s business intelligence software. Headset’s data is very reliable, as it comes digitally direct from our partner retailers. However, the potential does exist for misreporting in the instance of duplicates, incorrectly classified products, inaccurate entry of products into point-of-sale systems, or even simple human error at the point of purchase. Thus, there is a slight margin of error to consider. Brands listed on this page are ranked in the top twenty within the market and product category by total retail sales volume.

