.svg)
Aug-2026
Sales
Trend
6-Month
Product Count
SKUs
Avg Price
YoY Sales Change
YoY Price Change


Market Insights Snapshot
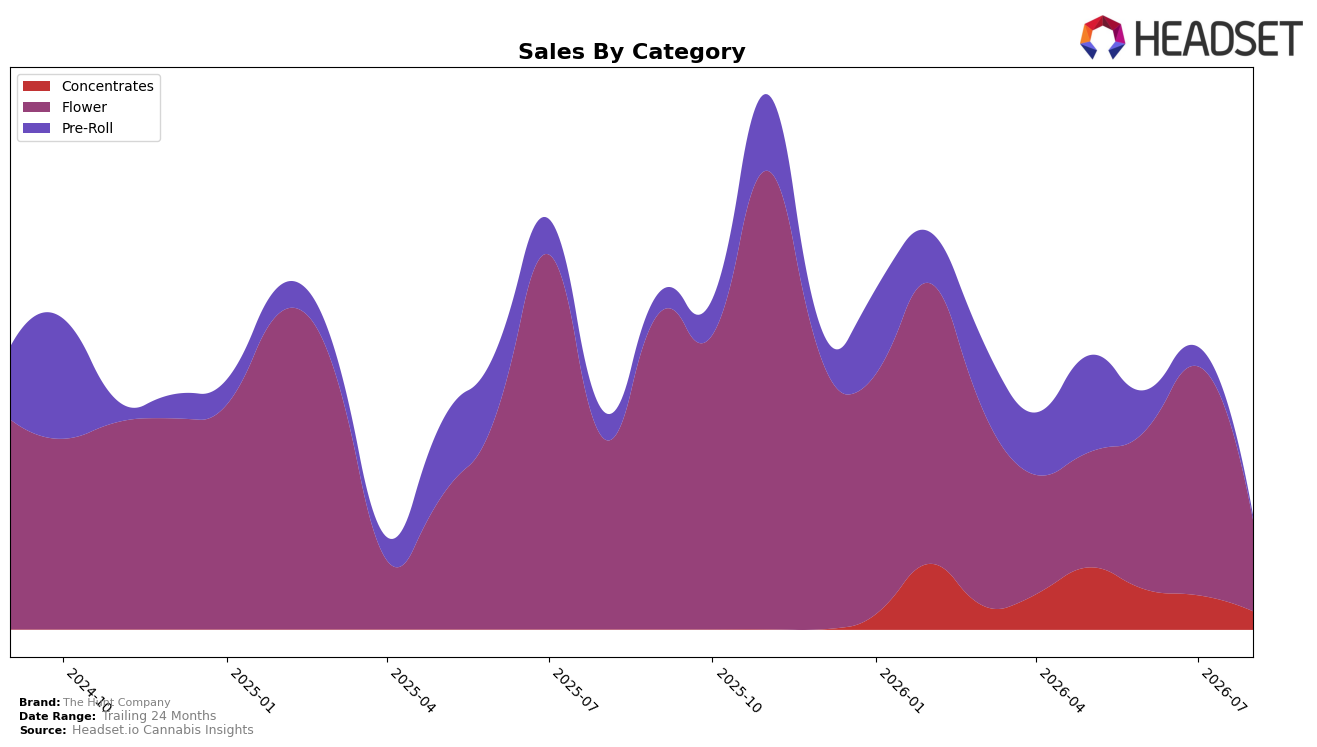
In August 2026, The Hunt Company concentrated 79.91% of sales in Flower while Pre-Roll accounted for 4.07% and Concentrates 16.02%, signaling a narrow mix anchored in a single category. Flower contracted sharply with a year-over-year decline of 52.42% and a month-over-month drop of 60.39%, while Pre-Roll fell 82.64% YoY and 76.05% MoM; Concentrates also declined 46.89% MoM despite no prior-year baseline. Average price rose 21.45% YoY to $23.78, and Flower’s average price sat at 23.92, indicating price elevation concurrent with volume contraction. With Flower ranked 75th in Illinois and its share near 80%, the pattern implies overexposure to a weakening pillar where price increases are not offsetting steep unit losses, leaving category concentration as the core execution risk.
These shifts imply The Hunt Company is trading toward higher price points while surrendering velocity in its primary category and failing to backfill with adjacent formats. A 60.39% MoM decline in Flower alongside a 46.89% MoM decline in Concentrates reduces cross-category capture, while the 76.05% MoM erosion in Pre-Roll removes a typical entry-price feeder, making the portfolio less elastic to demand shocks. With a 75th rank in Illinois Flower and an 82.64% YoY Pre-Roll decline, the portfolio skews toward fewer, higher-priced Flower units that limit basket breadth and discovery. The implication is clear: without redistributing mix away from Flower’s 79.91% share and re-establishing a lower-price on-ramp, the brand’s positioning will continue to lag on shelf where rank pressure compounds the volume impact of price-led strategy.
Competitive Landscape
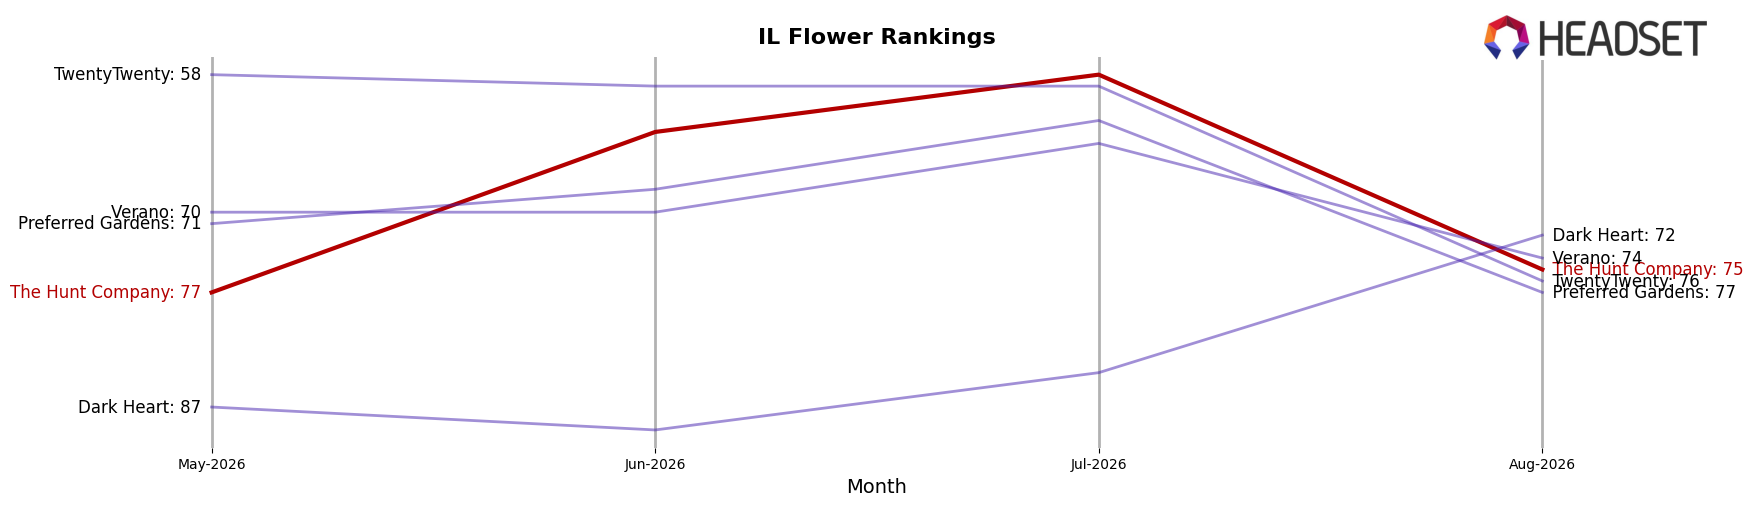
The Hunt Company sits at rank #75 in Illinois Flower for August 2026, sliding 19 positions year over year from #56, while improving 2 spots versus the last three-month mark of #77; against this backdrop, High Supply / Supply held #1 both this year and last despite a 10.13% YoY sales decline, and The Botanist surged from #29 to #4 on 482.08% YoY sales growth, indicating that competitive gains are concentrating near the top as mid-pack brands lose visibility. With a prior peak of #42 in July 2025 versus the current #75, and rivals like RYTHM steady at #2 alongside 36.45% YoY sales growth, the pattern implies The Hunt Company’s rank trajectory is drifting downward into a crowded middle where recovery will require outpacing leaders’ stability and climbers’ acceleration.
Notable Products
Big Detroit Energy (3.5g) posted the steepest movement in August 2026 with a -90.98% month-over-month drop and slid to rank 2, while Sake (3.5g) also collapsed by -89.92% at rank 9; by contrast, Blue Power Pre-Roll (1g) was comparatively steady at rank 4 with a -3.30% change. Booberry Cookies (3.5g) still held rank 1 despite a -37.13% decline, capturing the largest absolute sales at $42,074 and widening the gap between the lead SKU and the rest. Four of the top ten are Flower SKUs, but three of those Flower items fell by more than -37%, signaling that the portfolio’s heaviest-weighted category is overexposed to sharp monthly swings and may require rebalancing toward steadier formats.
Top Selling Cannabis Brands






Data for this report comes from real-time sales reporting by participating cannabis retailers via their point-of-sale systems, which are linked up with Headset’s business intelligence software. Headset’s data is very reliable, as it comes digitally direct from our partner retailers. However, the potential does exist for misreporting in the instance of duplicates, incorrectly classified products, inaccurate entry of products into point-of-sale systems, or even simple human error at the point of purchase. Thus, there is a slight margin of error to consider. Brands listed on this page are ranked in the top twenty within the market and product category by total retail sales volume.

