.svg)


Where to Buy
Thunder Farms is stocked at 48 licensed dispensaries across Oregon, with the deepest coverage in Portland, Eugene, Medford, Salem, and Albany. Search by ZIP code or city below to find the closest one, or filter by product type if you are after a specific format.
Market Insights Snapshot
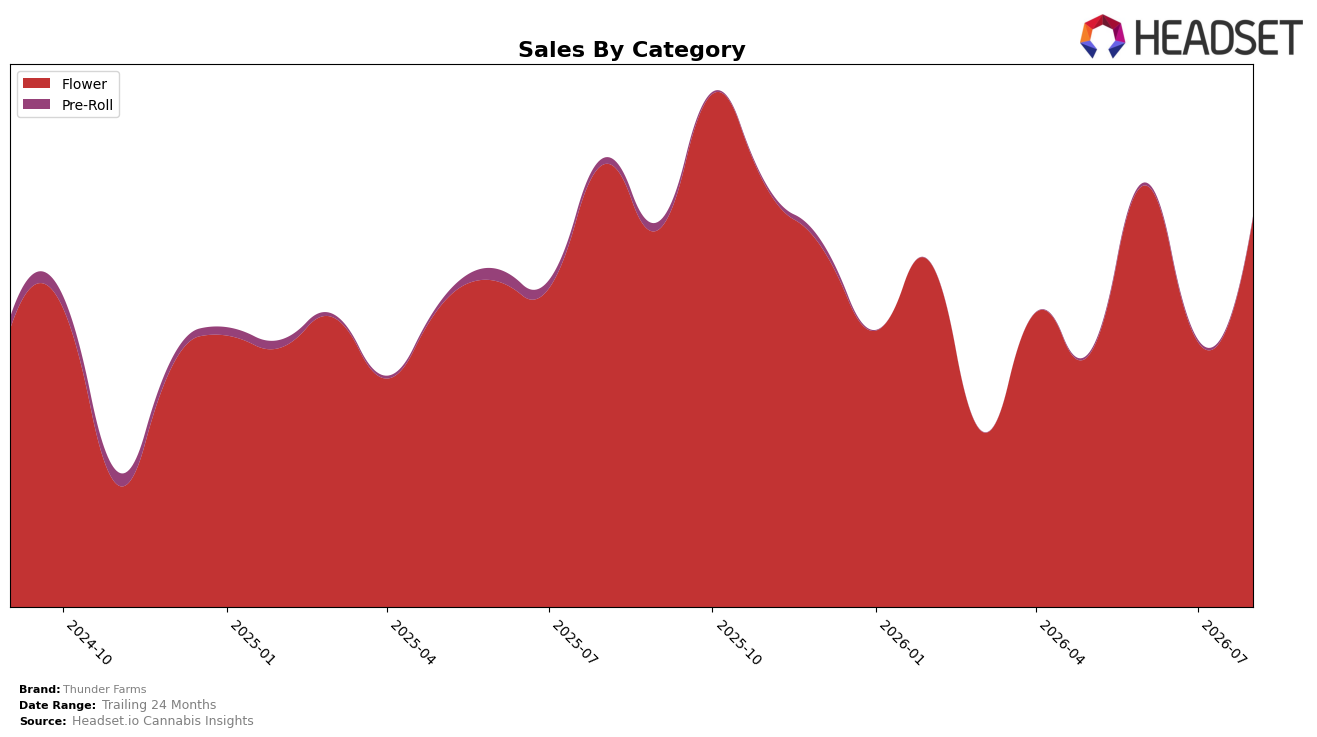
In August 2026, Thunder Farms concentrated 99.68% share in Flower with a 47.05% month-over-month surge alongside a 12.02% year-over-year decline, while Pre-Roll fell to 0.32% share with a 40.23% MoM drop and a 79.36% YoY contraction. Average price rose 77.26% YoY to $30.55 as Flower pricing averaged $31.63, indicating mix-driven reliance on higher-priced Flower despite brand-level sales down 12.93% YoY; the brand’s Flower rank sat at 46 in Oregon, which, combined with the near-single-category footprint, implies volume sensitivity to price and limited cross-category buffering.
The shift toward a 99.68% Flower mix with a 47.05% MoM rebound but a 12.02% YoY slide, paired with a 79.36% YoY collapse in Pre-Roll and a 40.23% MoM pullback, implies Thunder Farms is leaning into fewer SKUs at higher price points, trading short-term MoM lift for reduced resilience across demand occasions. With overall brand sales down 12.93% YoY and a Flower rank of 46 in Oregon, the elevated price architecture is likely compressing velocity, and the near-elimination of Pre-Roll suggests a positioning that prioritizes premiumized Flower over entry or trial formats, increasing exposure to competitive pricing tiers and seasonal volatility.
Competitive Landscape
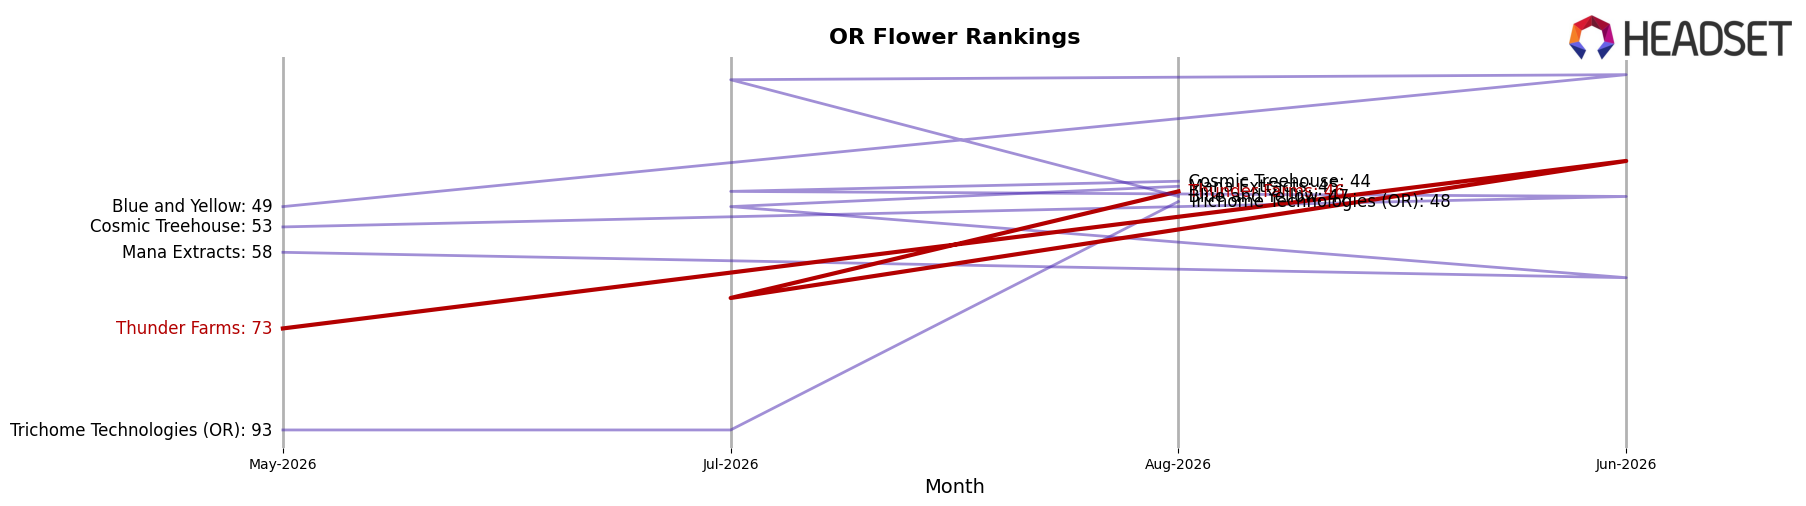
Thunder Farms sits at rank #46 in OR Flower in August 2026, sliding 6 positions year over year from #40 but rising 27 spots since May 2026 when it was #73; against that backdrop, Grown Rogue advanced from #3 to #1 with 49.1% YoY sales growth while Oregrown climbed from #23 to #3 alongside 182.4% YoY growth, creating upward pressure near the top tiers. Thunder Farms’ current #46 also trails its peak #36 from October 2025 by 10 ranks, whereas Panda Farms jumped from #99 to #4 on 1,059.6% YoY growth, indicating that share is concentrating among fast-rising leaders even as Thunder Farms improves from its recent #73 trough; the pattern implies a mid-pack stall-out risk unless rank recovery accelerates to close a widening gap with top-5 risers.
Notable Products
Alaskan Thunder Fuck (3.5g) posted the sharpest move in August 2026 with a +98.5% MoM surge to rank 5, while Alaskan Thunder Fuck (Bulk) rose +60.0% to rank 1, establishing a dual-format lift that outpaced a -30.4% MoM slide for Super Boof (Bulk) at rank 2. With nine of the top ten SKUs in Flower and at least three formats of Alaskan Thunder Fuck inside the top nine, the portfolio is concentrated around one strain family even as 25 Eyes (3.5g) added a +51.1% MoM gain at rank 8. The concentration around Alaskan Thunder Fuck, coupled with mixed results for Super Boof, implies Thunder Farms is consolidating demand into a hero strain across sizes to drive share while pruning weaker variants.
Top Selling Cannabis Brands






Data for this report comes from real-time sales reporting by participating cannabis retailers via their point-of-sale systems, which are linked up with Headset’s business intelligence software. Headset’s data is very reliable, as it comes digitally direct from our partner retailers. However, the potential does exist for misreporting in the instance of duplicates, incorrectly classified products, inaccurate entry of products into point-of-sale systems, or even simple human error at the point of purchase. Thus, there is a slight margin of error to consider. Brands listed on this page are ranked in the top twenty within the market and product category by total retail sales volume.

