Jun-2026
Sales
Trend
6-Month
Product Count
SKUs
Avg Price
YoY Sales Change
YoY Price Change
Market Insights Snapshot
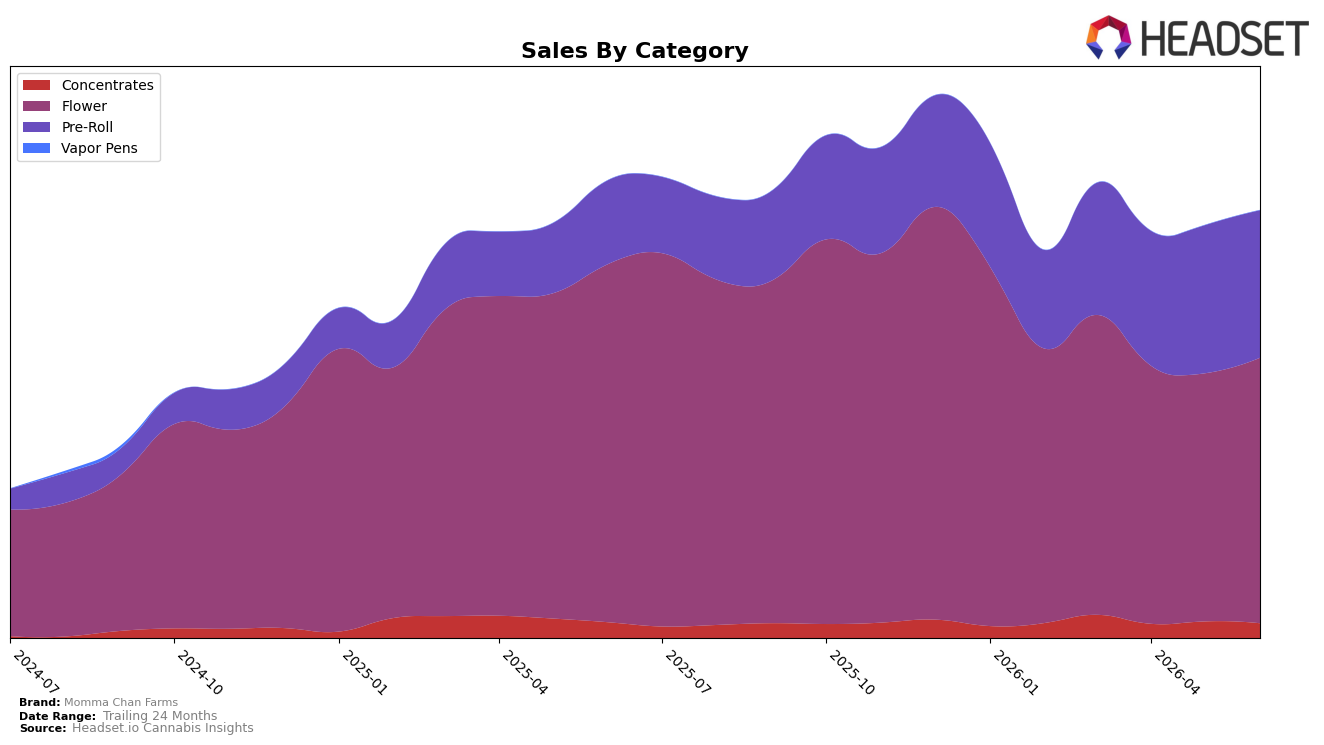
In June 2026, Momma Chan Farms concentrated 62.10% of sales in Flower, where year-over-year sales declined 25.92% but month-over-month rose 7.02%, while Pre-Roll expanded to 34.47% share with a 76.21% year-over-year increase even as month-over-month slipped 0.36%. Concentrates held 3.43% share with a 6.47% year-over-year decline and an 11.10% month-over-month drop, and the brand’s average price fell 27.36% year-over-year alongside a brand-level sales change of -6.59% year-over-year. In Washington Flower specifically, the brand sat at rank 20, indicating that the 7.02% month-over-month recovery did not overturn the category’s 25.92% annual contraction; the pattern implies the growth engine has shifted toward Pre-Roll while Flower remains the volume anchor under price pressure.
The mix shift toward Pre-Roll (34.47% share with 76.21% year-over-year growth) against a 25.92% Flower decline and an 11.10% month-over-month drop in Concentrates implies an intentional pivot toward lower price-point, higher-throughput formats as the 27.36% average price decrease widens accessibility. Holding rank 20 in Washington Flower while Flower still accounts for 62.10% of sales suggests that price-led stabilization (+7.02% month-over-month) can support baseline velocity, but sustained brand growth likely depends on continuing to convert consumers into Pre-Roll while managing Flower price floors to prevent further share erosion.
Competitive Landscape
Momma Chan Farms sits at rank #20 in WA Flower in June 2026, down 8 spots year over year from #12, and 3 spots lower than March 2026’s #17, while still trailing its peak position of #9 from December 2025; in contrast, Phat Panda held #1 year over year and remains #1 with 16.6% YoY sales growth, and Lifted Cannabis Co climbed from #8 to #3 with 17.9% YoY growth, indicating that Momma Chan Farms’ downward rank shift is more about share displacement than category contraction and implies a need to counter faster-rising competitors to avoid further slide.

Notable Products
Rainier Cherry Gelato Pre-Roll 2-Pack (1g) posted the largest month-over-month jump at +55.4% while climbing within the top five at rank 5, and Gas Face OG Pre-Roll 2-Pack (1g) followed with +53.2% to secure rank 2; together these outsized gains reshape the top tier toward faster-turning pre-rolls. Hallie Berry Pre-Roll 2-Pack (1g) held rank 1 with +21.3% while Crazy 88 Pre-Roll 2-Pack (1g) in rank 3 grew only +1.9%, a divergence that widens the gap among leaders and concentrates momentum at the top. Nine of the top ten are Pre-Roll SKUs, while Hallie Berry (4g) at rank 6 grew +11.2% despite being the lone Flower item and delivered $36,796, indicating a two-format barbell where pre-roll breadth drives velocity and a single flower anchor sustains basket value.
Top Selling Cannabis Brands
Data for this report comes from real-time sales reporting by participating cannabis retailers via their point-of-sale systems, which are linked up with Headset’s business intelligence software. Headset’s data is very reliable, as it comes digitally direct from our partner retailers. However, the potential does exist for misreporting in the instance of duplicates, incorrectly classified products, inaccurate entry of products into point-of-sale systems, or even simple human error at the point of purchase. Thus, there is a slight margin of error to consider. Brands listed on this page are ranked in the top twenty within the market and product category by total retail sales volume.

