May-2026
Sales
Trend
6-Month
Product Count
SKUs
Avg Price
YoY Sales Change
YoY Price Change
Market Insights Snapshot
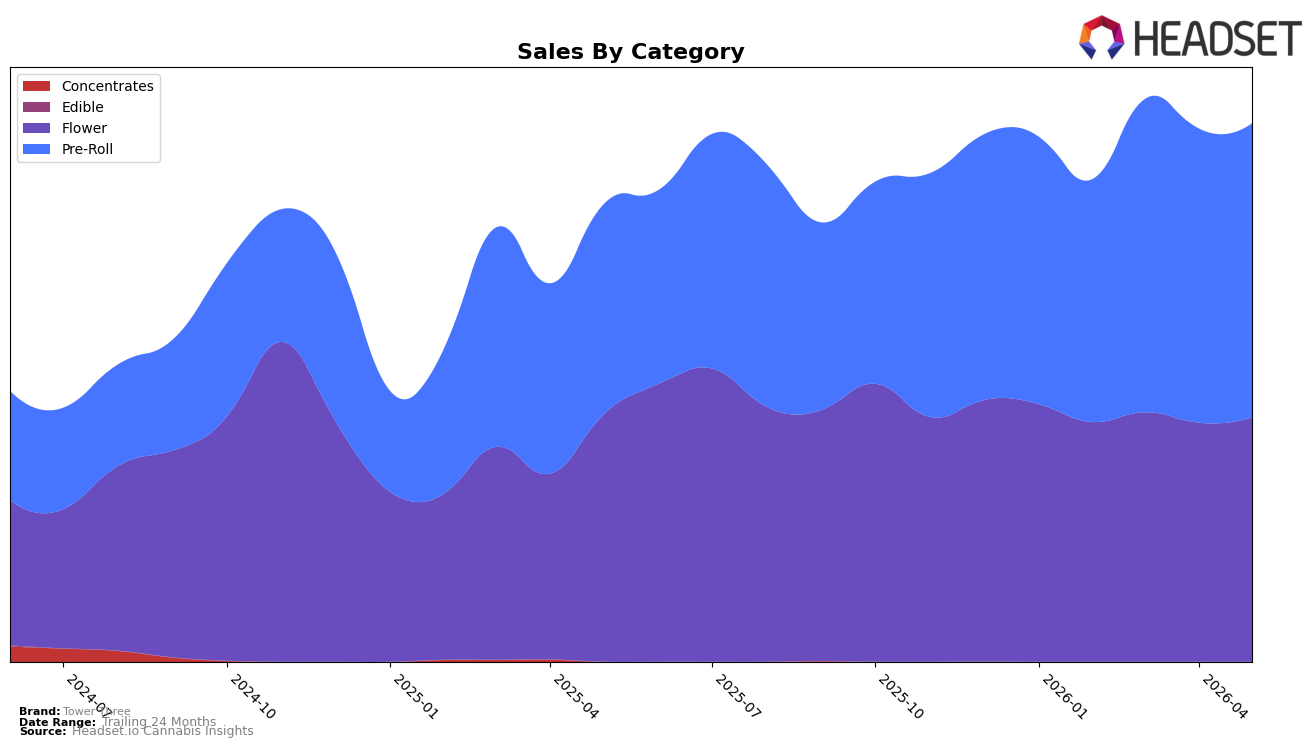
In May 2026, Tower Three concentrated 54.62% of sales in Pre-Roll with 45.38% in Flower, marking a category tilt where Pre-Roll grew 39.91% year over year while Flower declined 1.07% year over year. Month over month, Pre-Roll slipped 0.05% as Flower rose 2.20%, indicating a near-term rebalancing despite the brand’s overall 17.75% year-over-year sales lift and a 14.44% drop in average price. With Pre-Roll’s average price at $10.22 versus Flower at $39.25, the mix is migrating toward lower-ticket volume, and a rank of 10 in Pre-Roll in Massachusetts implies room to trade share within that channel while protecting the 54.62% sales base.
The combination of a 39.91% Pre-Roll surge and a 1.07% Flower decline, alongside a 0.05% Pre-Roll month-over-month dip vs. a 2.20% Flower month-over-month rise, implies Tower Three’s positioning is anchored in value-driven Pre-Rolls that deliver volume elasticity at lower price points. The 14.44% average price decrease paired with a 17.75% brand sales increase suggests price-led access is working, but the slight Pre-Roll month-over-month softness and a rank of 10 in Pre-Roll in Massachusetts signal the next gains likely come from tightening price-pack architecture and activating trade-up paths that lift Flower’s 45.38% share without eroding Pre-Roll’s scale.
Competitive Landscape
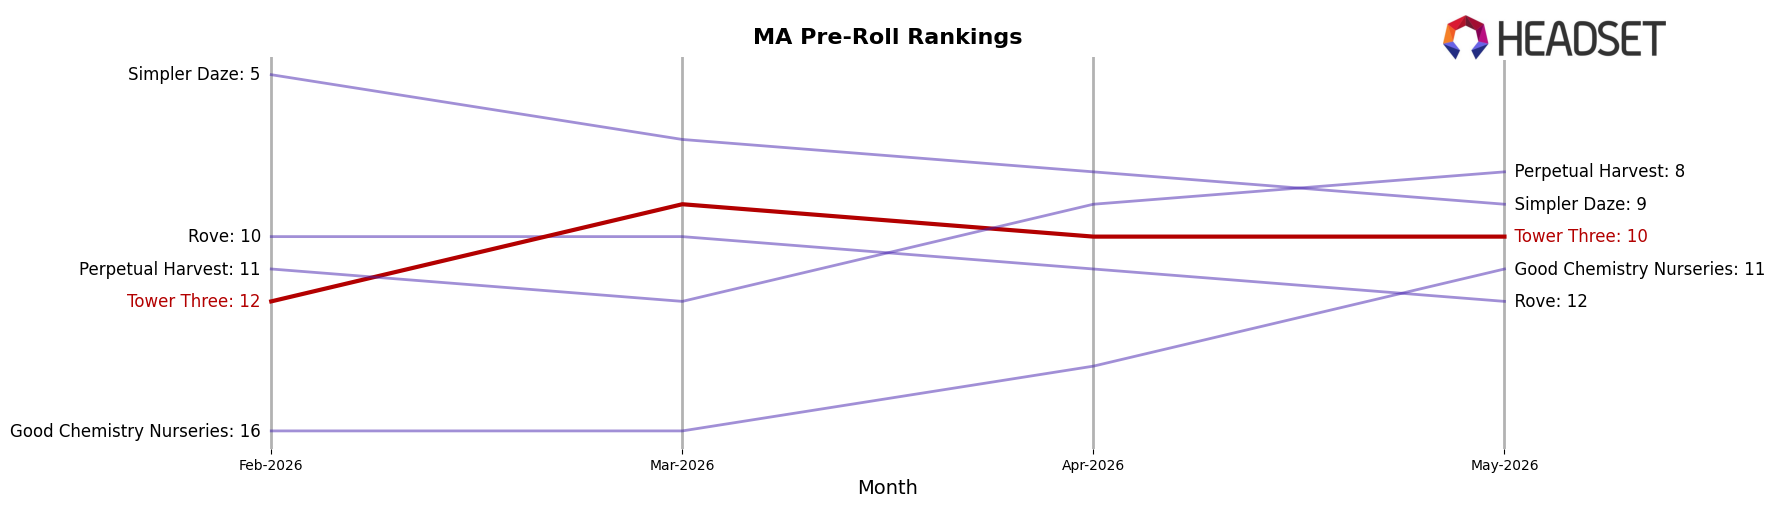
Tower Three sits at #10 in MA Pre-Roll in May 2026, improving 10 places from #20 year over year, and nudging up 2 spots from #12 in February 2026, while its peak of #9 in March 2026 signals momentum that briefly surpassed the current level. In contrast, Jeeter held steady at #1 with a 22.0% year-over-year sales increase, and Cali-Blaze surged from #58 to #2 on 961.2% YoY growth, indicating that Tower Three’s 10-rank YoY climb is meaningful but being outpaced by faster risers near the top. With Northern Grown jumping from #26 to #4 alongside 176.3% YoY growth and Happy Valley (MA) advancing from #8 to #5 on 41.5% YoY growth, the pattern implies Tower Three’s trajectory is upward but requires sharper acceleration to convert a #10 position and a #9 peak into durable top-5 presence.
Notable Products
Oishii Pre-Roll (1g) posted the steepest decline in May 2026 at -31.3% MoM while holding rank 5, as Lemon S'mores Pre-Roll (1g) fell -24.4% MoM to rank 4. Cherry Maple Pre-Roll (1g) rose 11.2% MoM to rank 3, and Gyros Pre-Roll (1g) and Florida Freeze Pre-Roll (1g) advanced 34.0% and 42.0% MoM respectively while remaining outside the top three; eight of the top ten SKUs are Pre-Roll variants, concentrating mix in a single format. Moonbutter Pre-Roll (1g) led at rank 1 with $51,474 as East Coast Irene Pre-Roll (1g) slid -15.3% MoM to rank 2. The pattern implies Tower Three is leaning into breadth within Pre-Rolls while tolerating volatility at the SKU level to keep the category’s aggregate share on top.
Top Selling Cannabis Brands
Data for this report comes from real-time sales reporting by participating cannabis retailers via their point-of-sale systems, which are linked up with Headset’s business intelligence software. Headset’s data is very reliable, as it comes digitally direct from our partner retailers. However, the potential does exist for misreporting in the instance of duplicates, incorrectly classified products, inaccurate entry of products into point-of-sale systems, or even simple human error at the point of purchase. Thus, there is a slight margin of error to consider. Brands listed on this page are ranked in the top twenty within the market and product category by total retail sales volume.

