Market Insights Snapshot
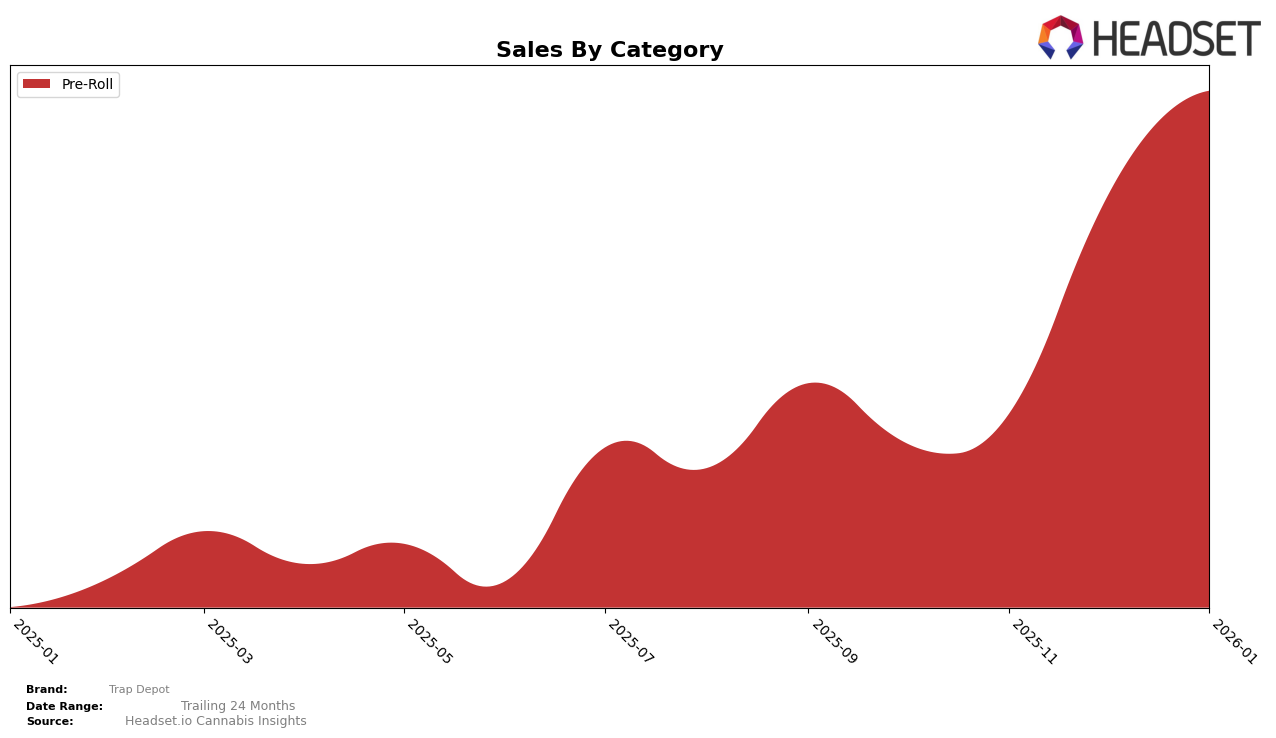
Trap Depot has shown a significant upward trajectory in the Pre-Roll category within Michigan. Starting from a rank of 87 in October 2025, the brand has impressively climbed to the 25th position by January 2026. This movement highlights a strong growth pattern, particularly notable as they were outside the top 30 just a few months prior. The brand's sales figures reflect this upward trend, with a consistent increase from $113,708 in October to $338,712 by January. Such a rapid ascent in rankings and sales suggests a growing consumer preference for Trap Depot's offerings in this category, potentially indicating successful marketing strategies or product quality improvements.
It's important to note that Trap Depot's presence in other states and categories is currently not within the top 30, which could be seen as a challenge for the brand's expansion efforts. This absence from the top rankings in other markets might suggest a need for strategic realignment or increased focus on those areas to replicate their success in Michigan. While the Pre-Roll category in Michigan is a clear stronghold for Trap Depot, there is potential for growth in other categories and states if they can leverage their current momentum effectively. Specific details on their performance in other regions remain undisclosed, but the current trajectory in Michigan could serve as a blueprint for broader market penetration.
Competitive Landscape
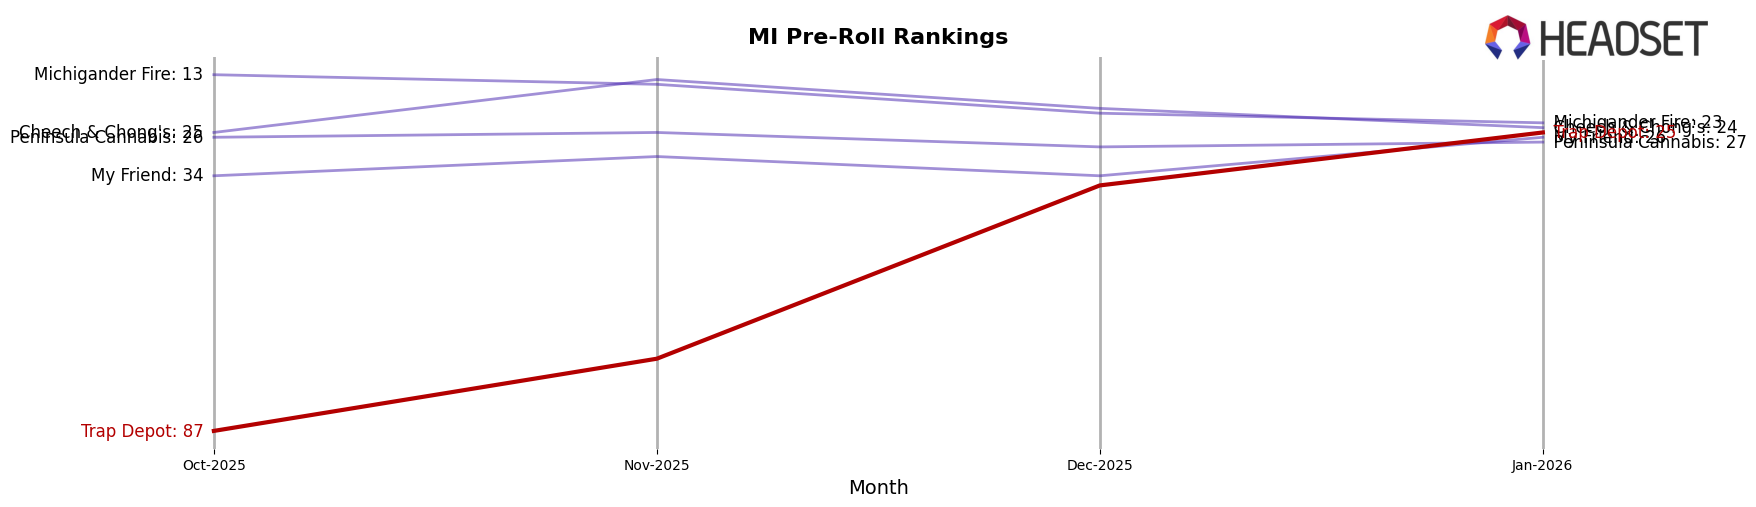
In the competitive landscape of the Michigan pre-roll category, Trap Depot has shown a remarkable upward trajectory in recent months, moving from a rank of 87 in October 2025 to 25 by January 2026. This significant climb in rank is indicative of a robust increase in market presence and consumer preference, as evidenced by a substantial rise in sales from October to January. In contrast, competitors like Michigander Fire and Cheech & Chong's have experienced a decline in rank, with Michigander Fire dropping from 13 to 23 and Cheech & Chong's from 14 to 24 over the same period. This shift suggests that Trap Depot is effectively capturing market share from these established brands. Meanwhile, Peninsula Cannabis and My Friend have maintained relatively stable positions, indicating less volatility but also less growth compared to Trap Depot. This dynamic positioning highlights Trap Depot's potential to continue its ascent in the Michigan pre-roll market, making it a brand to watch for future growth opportunities.
Notable Products
In January 2026, the top-performing product from Trap Depot was the Tarantula - Juicy Watermelon Infused Pre-Roll (1.2g), maintaining its first-place position from December 2025 with sales reaching 10,318 units. The Tarantula - Blueberry Infused Pre-Roll (1.2g) climbed to the second position, improving from third place in December 2025. Fire Crackers Infused Pre-Roll (1.2g) made a notable entry into the rankings, securing the third spot. Tarantula - Peach Cream Infused Pre-Roll (1.2g) rose to fourth place from fifth in the previous month. Finally, Tarantula - Grape Soda Infused Pre-Roll (1.2g) slipped to fifth place, having been ranked fourth in December 2025.
Top Selling Cannabis Brands
Data for this report comes from real-time sales reporting by participating cannabis retailers via their point-of-sale systems, which are linked up with Headset’s business intelligence software. Headset’s data is very reliable, as it comes digitally direct from our partner retailers. However, the potential does exist for misreporting in the instance of duplicates, incorrectly classified products, inaccurate entry of products into point-of-sale systems, or even simple human error at the point of purchase. Thus, there is a slight margin of error to consider. Brands listed on this page are ranked in the top twenty within the market and product category by total retail sales volume.

