.svg)

Sep-2026
Sales
Trend
6-Month
Product Count
SKUs
Avg Price
YoY Sales Change
YoY Price Change


Market Insights Snapshot
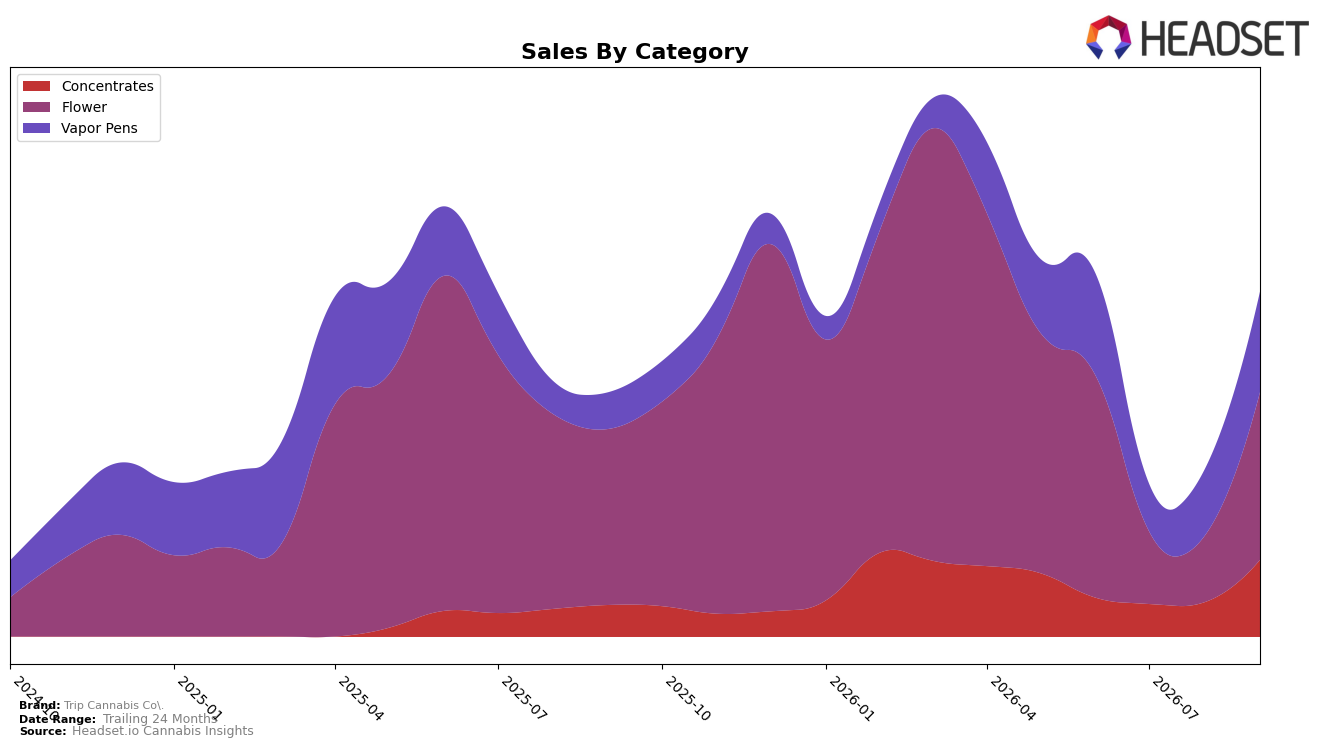
Trip Cannabis Co. concentrated nearly half of September 2026 volume in Flower at 48.61% share, but that segment slid year over year by 4.73% even as month-over-month sales surged 153.91%, indicating a tactical rebound atop a softer annual base; Vapor Pens rose to 29.12% share with a 175.72% YoY jump and 51.67% MoM gain, while Concentrates reached 22.28% share with 142.84% YoY and 123.04% MoM growth. With an average price decline of 11.94% alongside category-level price points spanning $45.90 in Flower and roughly $22–23 in Vapor Pens and Concentrates, the mix shift toward lower-priced formats and the rapid MoM lift suggest elasticity-driven volume capture that offsets Flower’s YoY contraction.
Position-wise, the tilt toward Vapor Pens and Concentrates—together 51.39% share with triple-digit YoY growth (175.72% and 142.84%, respectively) and double-digit-to-triple-digit MoM gains (51.67% and 123.04%)—reduces reliance on Flower at a time when Flower’s annual trend is negative 4.73% despite a sharp 153.91% monthly bounce. In Arizona, where Trip Cannabis Co. sits at rank 42 in Flower, the combination of a lower overall average price and expanding penetration in extract-based formats implies a value-forward, inhalables-centric stance designed to widen basket reach while ceding premium Flower rank headroom to pursue faster-turn categories.
Competitive Landscape
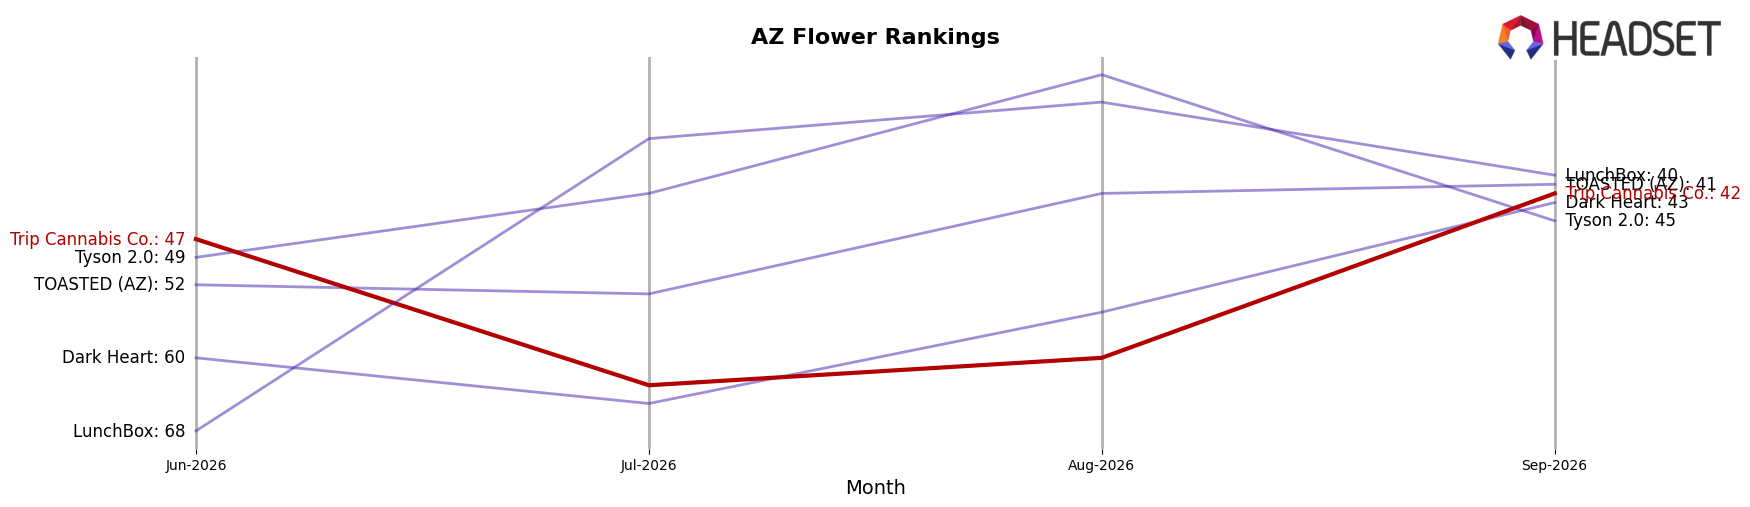
Trip Cannabis Co. sits at rank #42 in AZ Flower for September 2026, improving 2 positions year over year from #44 while also rising 5 spots since June 2026 from #47, and yet remaining 4 places below its March 2026 peak at #38 signals partial recovery rather than a full return. In contrast, Find. climbed from #3 to #2 year over year, and Loud Pax surged from #51 to #5 with a 2,181.5% YoY sales increase, indicating the top tier is compressing upward as mid-pack brands face steeper leapfrogging. The pattern implies Trip Cannabis Co.’s modest rank gains are being outpaced by faster-advancing competitors, so without acceleration beyond a 2-rank YoY climb, reattaining or surpassing the #38 peak is unlikely amid intensified upward mobility at the top.
Notable Products
TK Latte (14g) posted the steepest movement in September 2026 with a -33% month-over-month drop and slid to rank 6, indicating a material pullback in mid-tier Flower while Vapor Pens consolidated share at the top. Mint Chip Diamonds Disposable (2g) rose 9% month over month to hold rank 1 and generated $31,356, while three Vapor Pens clustered in ranks 1 and 8 suggest a tilt toward inhalable convenience over bulk Flower. With Flower occupying ranks 2 through 6 yet showing the only double-digit decline at -33%, the mix points to Trip Cannabis Co. leaning into flavored, liquid-diamond disposables as the growth anchor while trimming exposure to slower-moving large-format Flower.
Top Selling Cannabis Brands






Data for this report comes from real-time sales reporting by participating cannabis retailers via their point-of-sale systems, which are linked up with Headset’s business intelligence software. Headset’s data is very reliable, as it comes digitally direct from our partner retailers. However, the potential does exist for misreporting in the instance of duplicates, incorrectly classified products, inaccurate entry of products into point-of-sale systems, or even simple human error at the point of purchase. Thus, there is a slight margin of error to consider. Brands listed on this page are ranked in the top twenty within the market and product category by total retail sales volume.

