May-2026
Sales
Trend
6-Month
Product Count
SKUs
Avg Price
YoY Sales Change
YoY Price Change
Market Insights Snapshot
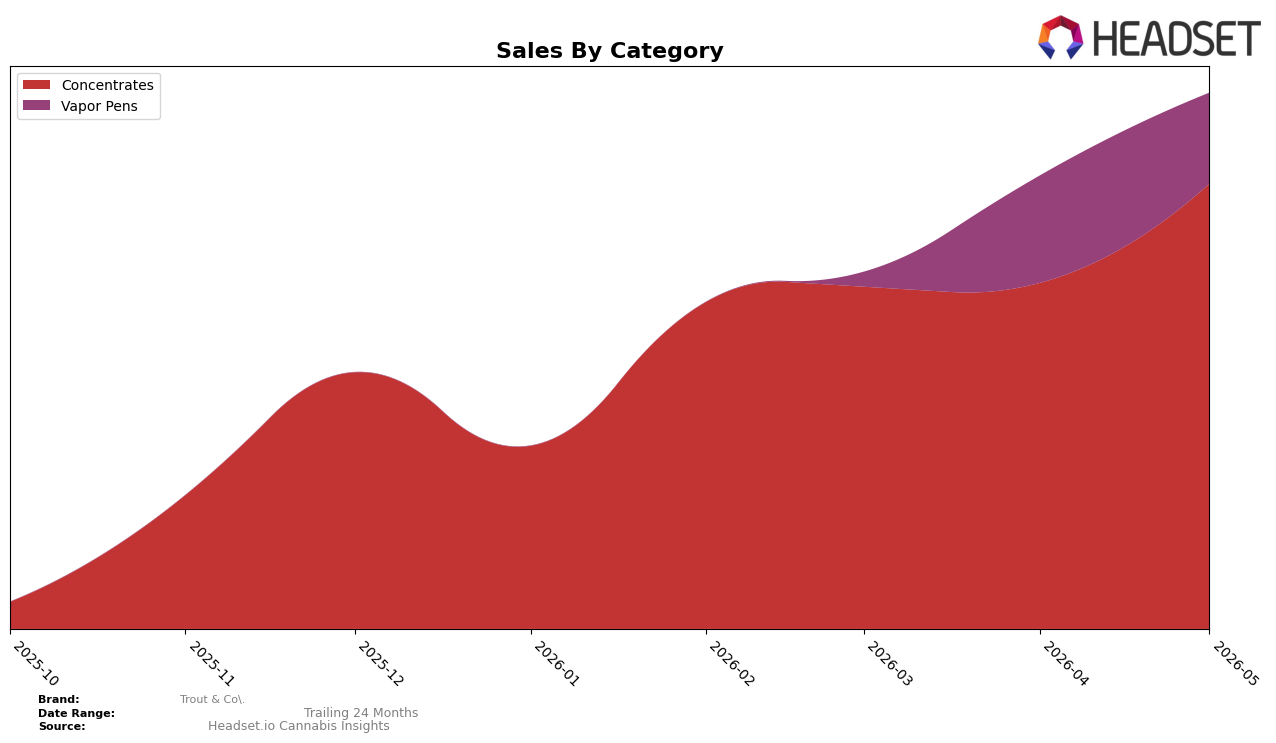
Concentrates carried 83.07% share in May 2026 with a month-over-month change of 28.73%, while Vapor Pens held 16.93% share with a month-over-month decline of 15.31%; the average price split between categories was $71.71 for Concentrates versus 56.28 for Vapor Pens. Within New York, Trout & Co. ranked 14th in Concentrates, and the overall brand average price was 68.53, placing the portfolio between the two category price points; the concentration of revenue in a single category at 83.07% alongside a two-category footprint suggests a deliberate tilt toward higher-priced formats. The pattern implies Trout & Co. is leaning into Concentrates momentum and de-emphasizing Vapor Pens exposure, accepting a narrower category spread to pursue efficiency in a segment where it holds rank 14.
The 28.73% month-over-month lift in Concentrates against a simultaneous 15.31% month-over-month contraction in Vapor Pens indicates share consolidation toward the flagship format, while the 83.07% to 16.93% split concentrates demand risk and pricing power within one lane. With rank 14 in New York Concentrates and a portfolio average price of 68.53 straddling the category price gap (71.71 vs 56.28), Trout & Co. is positioned as a value ladder into Concentrates rather than a price-extension in Vapor Pens. The implication is that near-term positioning favors depth over breadth, prioritizing reinforcement of Concentrates velocity and pricing alignment over rebuilding Vapor Pens distribution.
Competitive Landscape
Trout & Co. sits at rank #14 in New York Concentrates in May 2026, a climb of 2 positions versus February 2026, and it matches its peak rank of #14 set in May 2026 while improving from #16 three months prior; in contrast, Jetpacks advanced from #4 to #2 year over year and posted 128.6% YoY sales growth, while UMAMII surged from #30 to #4 alongside 3,769.7% YoY growth. Compared with the stable #1 position of Mfny (Marijuana Farms New York) holding rank #1 both this year and last (+55.0% YoY sales), Trout & Co.’s incremental rank lift of 2 places over three months signals that near-term share gains are attainable but will require faster velocity than peers that have jumped 26+ positions year over year.

Notable Products
Guava Glaze Cold Cure Live Rosin (1g) posted the headline move in May 2026 with a 3,889.8% month-over-month surge into rank 2, while Guava Glaze Rosin Disposable (0.5g) fell 55.9% to rank 5, signaling a decisive swing from disposables toward solventless jars. Guava Glaze Live Rosin (1g) held rank 1 despite a 12.2% decline, and Strawberry Crispr Live Rosin Disposable (0.5g) jumped 289.9% to rank 3, indicating a barbell where one disposable breaks out even as another retreats; four of the top ten are Concentrates SKUs, concentrating momentum in that form factor. Black Maple Live Rosin (1g) climbed 757.2% to rank 7, while Private Reserve - Original Glue Cold Cure Rosin (2g) slipped 13.6% at rank 9, and the category skew implies consumers are trading into higher-potency solventless formats even as multi-gram premium tiers face mixed traction. The pattern points to Trout & Co. leaning into cold cure and live rosin jars over vapor pens, reallocating attention toward solventless depth where velocity is accelerating at triple- to quadruple-digit rates.
Top Selling Cannabis Brands
Data for this report comes from real-time sales reporting by participating cannabis retailers via their point-of-sale systems, which are linked up with Headset’s business intelligence software. Headset’s data is very reliable, as it comes digitally direct from our partner retailers. However, the potential does exist for misreporting in the instance of duplicates, incorrectly classified products, inaccurate entry of products into point-of-sale systems, or even simple human error at the point of purchase. Thus, there is a slight margin of error to consider. Brands listed on this page are ranked in the top twenty within the market and product category by total retail sales volume.

