

Sep-2026
Sales
Trend
6-Month
Product Count
SKUs
Avg Price
YoY Sales Change
YoY Price Change


Market Insights Snapshot
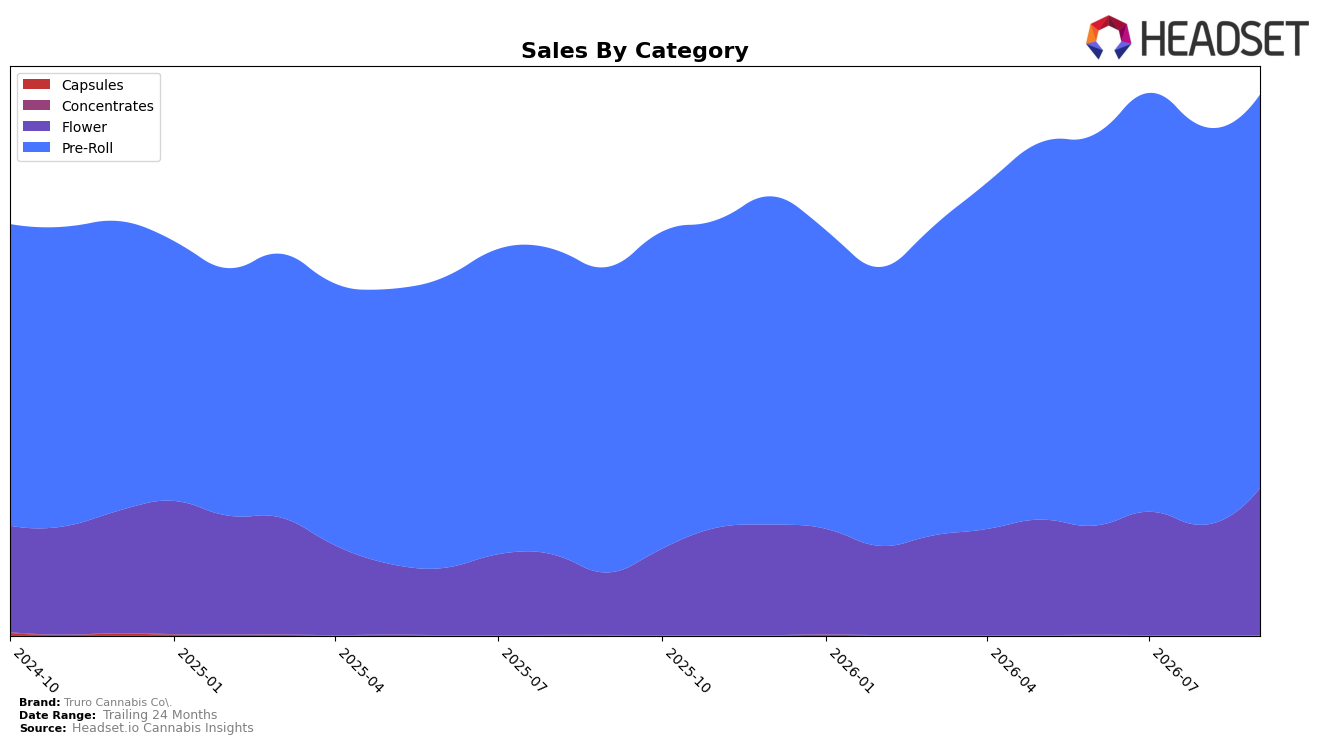
In September 2026, Truro Cannabis Co. derived 72.86% of sales from Pre-Roll with a year-over-year change of 28.81% and a month-over-month change of -1.06%, while Flower accounted for 27.14% with a year-over-year change of 135.89% and a month-over-month change of 33.22%. The brand’s average price rose 18.22% year over year to $13.29, alongside a Pre-Roll average price of 10.56 and a Flower average price of 43.36, indicating a deliberate mix shift tolerance for higher ticket sizes. With Pre-Roll ranked 35 in Ontario and Flower expanding share by 27.14% against a 72.86% Pre-Roll base, the pattern implies Truro Cannabis Co. is using Flower growth to counter Pre-Roll softness and reduce dependence on a single category.
The mix suggests near-term positioning pivots: the 33.22% month-over-month growth in Flower against a -1.06% month-over-month decline in Pre-Roll, coupled with a 135.89% year-over-year surge in Flower versus 28.81% in Pre-Roll, points to category rebalancing rather than pure volume drag. Given overall brand sales up 46.85% year over year and a Pre-Roll rank of 35 in Ontario, the widening Flower contribution at a 43.36 average price and the 18.22% brand-wide price lift imply Truro Cannabis Co. is trading into higher-value baskets to improve margin resilience and to create headroom for Pre-Roll rank improvement without over-reliance on discounting.
Competitive Landscape
Truro Cannabis Co. sits at rank #35 in ON Pre-Roll in September 2026, improving 5 positions year over year from #40 while slipping 4 spots versus June-to-September momentum from #39 to #35; July 2026 marked a peak at #30, a 14% better rank position than the current slot if you treat ranks as inverse performance, yet the quarter-over-quarter rank delta of +4 from #39 to #35 indicates partial recovery after a mid-summer dip. Against the competitive set, Back Forty / Back 40 Cannabis moved from #2 to #1 with 46.6% YoY sales growth while General Admission fell from #1 to #2 on a 38.2% YoY sales decline, and Spinach advanced from #17 to #4 alongside 141.2% YoY growth—together indicating that category share is concentrating toward faster-moving leaders while mid-pack ranks like #35 face upward pressure; the pattern implies Truro Cannabis Co.’s gradual YoY ascent of 5 ranks is not yet enough to outpace rapidly consolidating winners, so maintaining or improving distribution mix and velocity is necessary to avoid sliding back toward the #40 cohort.

Notable Products
The steepest decline was Caps Junky Pre-Roll (0.5g), down 35.4% month over month and sitting at rank 4, while Titanimal Bubble Hash and Kief Infused Pre-Roll (0.5g) fell 11.5% at rank 2. Tres Dawg x I 95 Pre-Roll (0.5g) in contrast grew 3.8% to hold rank 1, and Peggys Puff Pre-Roll (0.5g) slid 15.7% at rank 7. Eight of the top ten are Pre-Roll SKUs within a single-category concentration, with only one month featuring a clearly positive mover above 3% and three double-digit decliners, indicating reliance on a narrow format is amplifying volatility rather than diversifying revenue even as the leader generated $38,751 in September 2026.
Top Selling Cannabis Brands



Data for this report comes from real-time sales reporting by participating cannabis retailers via their point-of-sale systems, which are linked up with Headset’s business intelligence software. Headset’s data is very reliable, as it comes digitally direct from our partner retailers. However, the potential does exist for misreporting in the instance of duplicates, incorrectly classified products, inaccurate entry of products into point-of-sale systems, or even simple human error at the point of purchase. Thus, there is a slight margin of error to consider. Brands listed on this page are ranked in the top twenty within the market and product category by total retail sales volume.

