Jun-2026
Sales
Trend
6-Month
Product Count
SKUs
Avg Price
YoY Sales Change
YoY Price Change
Market Insights Snapshot
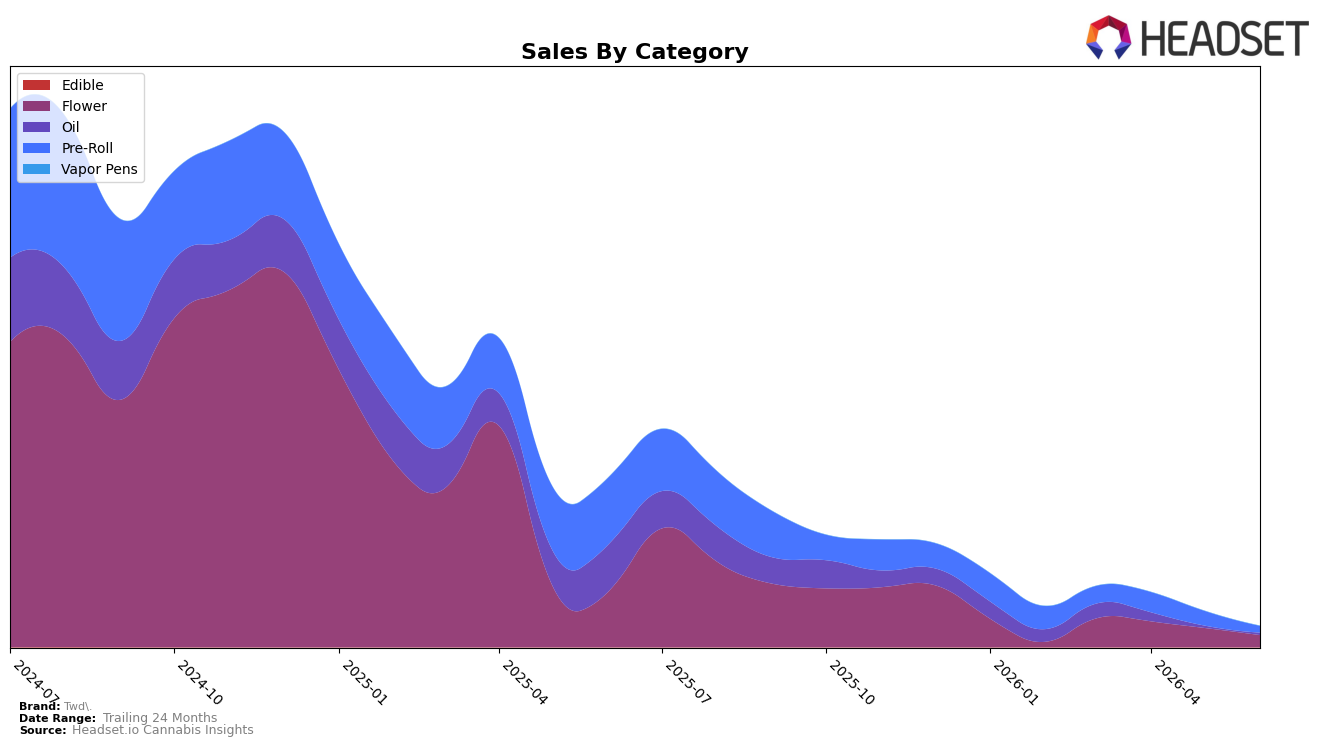
Twd.’s mix in June 2026 concentrated in Flower at 58.13% share with year-over-year sales down 78.58% and month-over-month down 37.57%, while Pre-Roll held 31.46% share with a 90.40% YoY decline and a 55.29% MoM drop; Oil accounted for 10.41% share with a 95.46% YoY decline but a 5.26% MoM increase. Despite an overall brand sales decline of 87.93% YoY and an average price lift of 63.39% YoY to $24.78, the category-level pattern shows reliance on two shrinking pillars and a small but stabilizing Oil pocket, implying mix pressure concentrated where declines are steepest and pricing moving against volume.
With Flower ranked 99 in Alberta and MoM trends at -37.57% in Flower versus -55.29% in Pre-Roll, the weaker Pre-Roll trajectory versus Flower indicates portfolio drag from value-oriented formats, while Oil’s +5.26% MoM suggests a niche that can offset some volatility. The combination of a 58.13% Flower weight and a 31.46% Pre-Roll weight alongside an 87.93% YoY brand contraction implies that overexposure to categories with steeper YoY falls is amplifying decline, and the price step-up of 63.39% YoY is likely repositioning Twd. away from the most price-elastic segments rather than restoring share.
Competitive Landscape
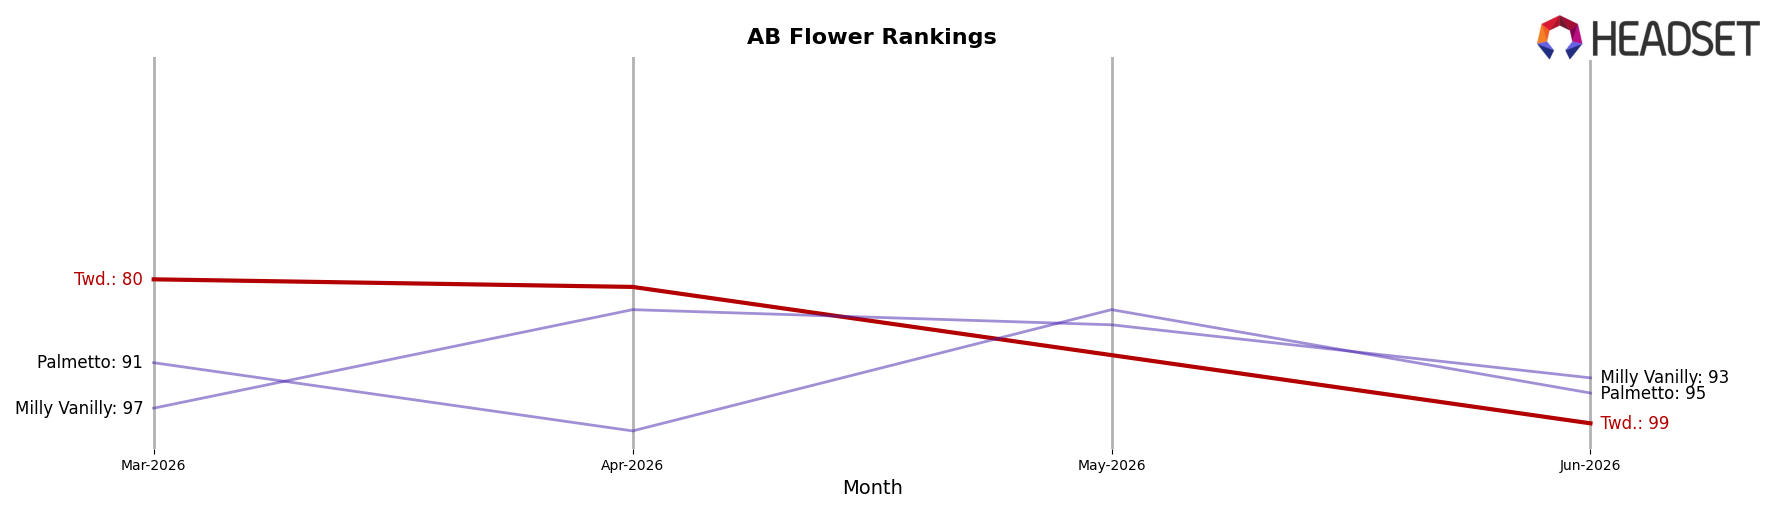
Twd. ranks #99 in AB Flower in June 2026, down 36 positions year over year from #63 and 19 positions below March 2026’s #80, signaling a multi-quarter slide from a peak of #15 in December 2024. In contrast, Pure Sunfarms advanced from #4 to #1 with +20.1% YoY sales, while Back Forty / Back 40 Cannabis held near the top at #2 despite a -23.5% YoY sales change, indicating that leadership is consolidating even as some leaders contract. Meanwhile, Big Bag O' Buds climbed from #7 to #3 on +35.0% YoY sales and Spinach moved from #5 to #4 with +11.1% YoY sales, suggesting consumer trade-up toward reliably available, value-forward multi-SKU lines. The pattern implies Twd.’s rank trajectory is drifting toward the long tail and will require either assortment pruning or price-pack reconfiguration to re-enter the top 50.
Notable Products
Sativa Pre-Roll (1g) posted the steepest movement in June 2026, falling 65.1% MoM and sliding to rank 2, while Indica Pre-Roll (1g) dropped 38.8% MoM yet held rank 1. Sativa Pre-Roll 12-Pack (6g) also contracted 56.0% MoM at rank 4, and Himalayan Kush (28g) declined 37.6% MoM at rank 3. With three of the top four positions held by Pre-Roll SKUs despite double-digit MoM contractions, the pattern implies Twd. is concentrated in a volatile format that is shedding momentum and may need diversification toward steadier Oil entries.
Top Selling Cannabis Brands
Data for this report comes from real-time sales reporting by participating cannabis retailers via their point-of-sale systems, which are linked up with Headset’s business intelligence software. Headset’s data is very reliable, as it comes digitally direct from our partner retailers. However, the potential does exist for misreporting in the instance of duplicates, incorrectly classified products, inaccurate entry of products into point-of-sale systems, or even simple human error at the point of purchase. Thus, there is a slight margin of error to consider. Brands listed on this page are ranked in the top twenty within the market and product category by total retail sales volume.

