Jun-2026
Sales
Trend
6-Month
Product Count
SKUs
Avg Price
YoY Sales Change
YoY Price Change
Market Insights Snapshot
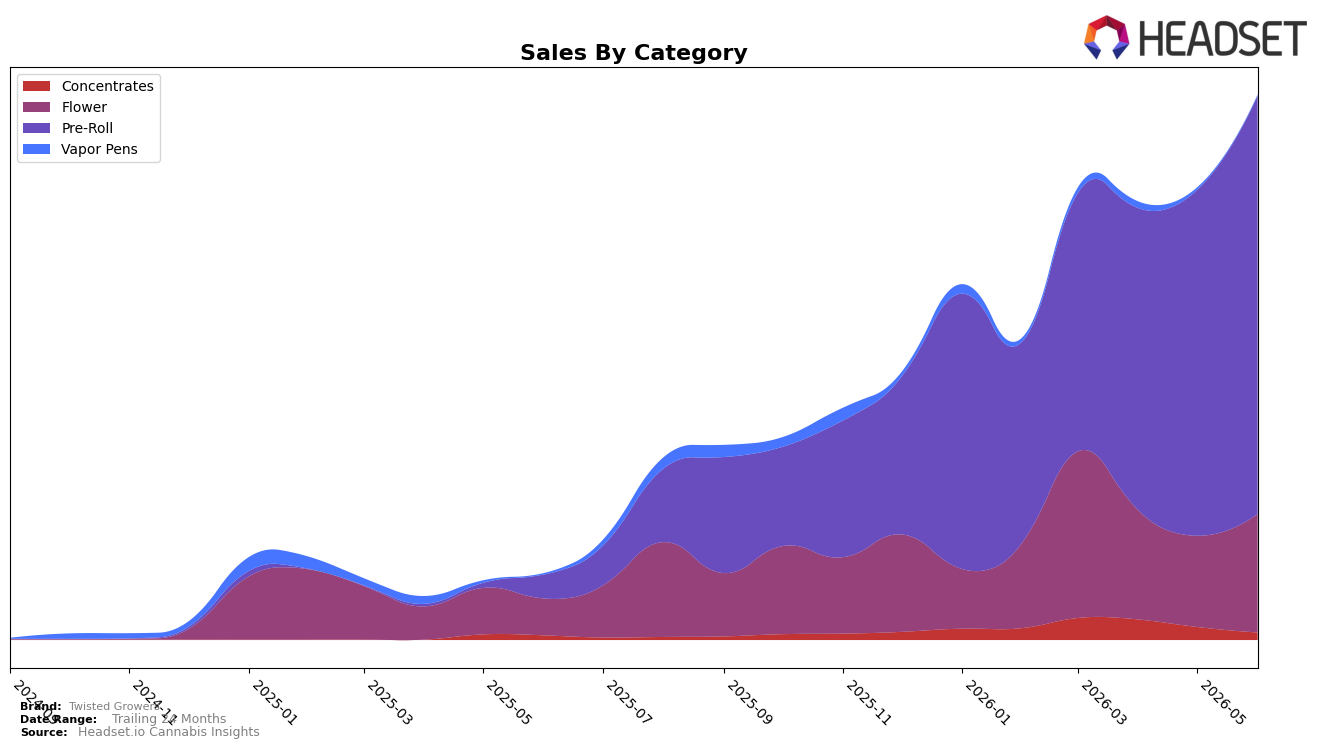
In June 2026, Twisted Growers concentrated 76.82% of sales in Pre-Roll, up 20.98% month over month and 1,673.88% year over year, while Flower held 21.70% share with a 30.04% MoM lift and 224.09% YoY growth. Smaller lines pulled back: Concentrates at 1.31% share fell 43.62% MoM despite 65.73% YoY growth, and Vapor Pens at 0.17% share declined 57.63% MoM and 15.34% YoY. Average price dropped 48.29% YoY to a single-month figure of $5.75 as Pre-Roll pricing centered at $4.71 and Flower at $21.09, implying volume-led expansion that tilts the mix toward lower price points.
The mix shift and pricing indicate a value-forward, high-velocity stance in Pre-Roll where the brand sits at rank 22 in Massachusetts, with Pre-Roll share at 76.82% and Flower at 21.70% underscoring a narrow but scaling portfolio. With Pre-Roll growing 20.98% MoM versus a 30.04% MoM rise in Flower, the secondary category is accelerating faster on a smaller base, while double-digit MoM contractions in Concentrates (-43.62%) and Vapor Pens (-57.63%) trim breadth. The pattern implies near-term gains will be driven by sustaining Pre-Roll velocity and selectively nurturing Flower to diversify without diluting the value position anchored by the 48.29% YoY price decline.
Competitive Landscape
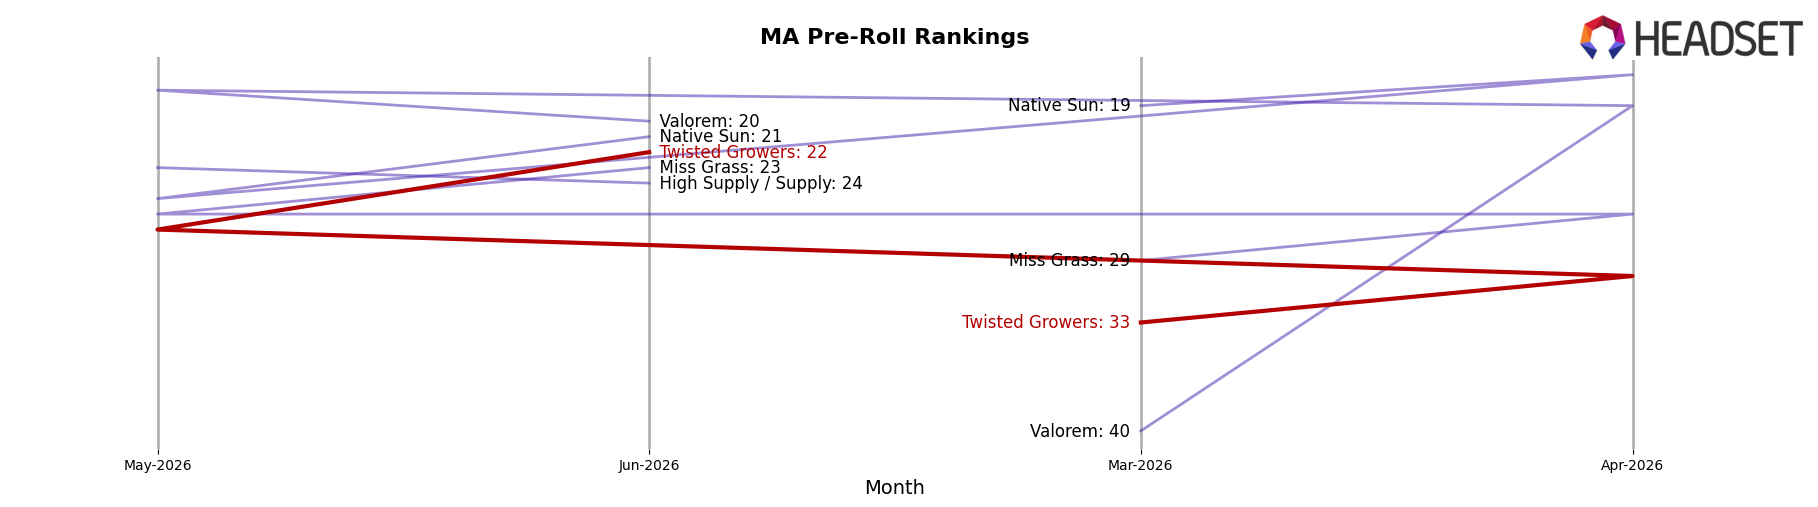
Twisted Growers sits at rank #22 in MA Pre-Roll in June 2026 after a year-over-year climb of 141 positions from #163, and it improved 11 spots from #33 in March 2026 to reach a new peak rank of #22 in June 2026, indicating a rapid mid-year acceleration. In contrast, Jeeter held steady at #1 year over year with a 17.2% sales increase, while Cali-Blaze advanced from #32 to #2 alongside a 472.5% sales lift, showing that leaders either defended or rapidly expanded share as Twisted Growers compressed triple-digit rank distance. The pattern implies Twisted Growers is transitioning from long-tail visibility toward the competitive mid-pack, where sustaining gains will require converting fast rank recovery into consistent top-20 penetration.
Notable Products
Strawberry Cookies Pre-Roll (1g) posted the headline move in June 2026 with a 102.8% month-over-month surge to rank 2, while Jelly Stick Pre-Roll (1g) sank 50.6% MoM to rank 10, indicating a sharp bifurcation in demand within the same format. Cherry Bomb Pre-Roll (1g) climbed 66.1% MoM to rank 3 and Purple Sunset Pre-Roll (1g) rose 56.9% MoM to rank 5, and eight of the top ten SKUs are Pre-Rolls in 1g format, pointing to a concentrated portfolio push rather than broad category diversification. Sef1or Giggles Pre-Roll (1g) held rank 1 with flat-to-unknown MoM change while Strawberry Muffin Pre-Roll (1g) advanced 58.4% MoM to rank 8, contrasting with Peanut Butter & Jelly Pre-Roll (1g) at a modest 10.2% MoM to rank 7, which implies flavor-led variants are separating into clear winners and laggards. Taken together, June 2026 signals that Twisted Growers is leaning into a hits-driven Pre-Roll lineup, prioritizing a few fast-accelerating SKUs over breadth to capture velocity in the 1g segment.
Top Selling Cannabis Brands
Data for this report comes from real-time sales reporting by participating cannabis retailers via their point-of-sale systems, which are linked up with Headset’s business intelligence software. Headset’s data is very reliable, as it comes digitally direct from our partner retailers. However, the potential does exist for misreporting in the instance of duplicates, incorrectly classified products, inaccurate entry of products into point-of-sale systems, or even simple human error at the point of purchase. Thus, there is a slight margin of error to consider. Brands listed on this page are ranked in the top twenty within the market and product category by total retail sales volume.

