Jun-2026
Sales
Trend
6-Month
Product Count
SKUs
Avg Price
YoY Sales Change
YoY Price Change
Market Insights Snapshot
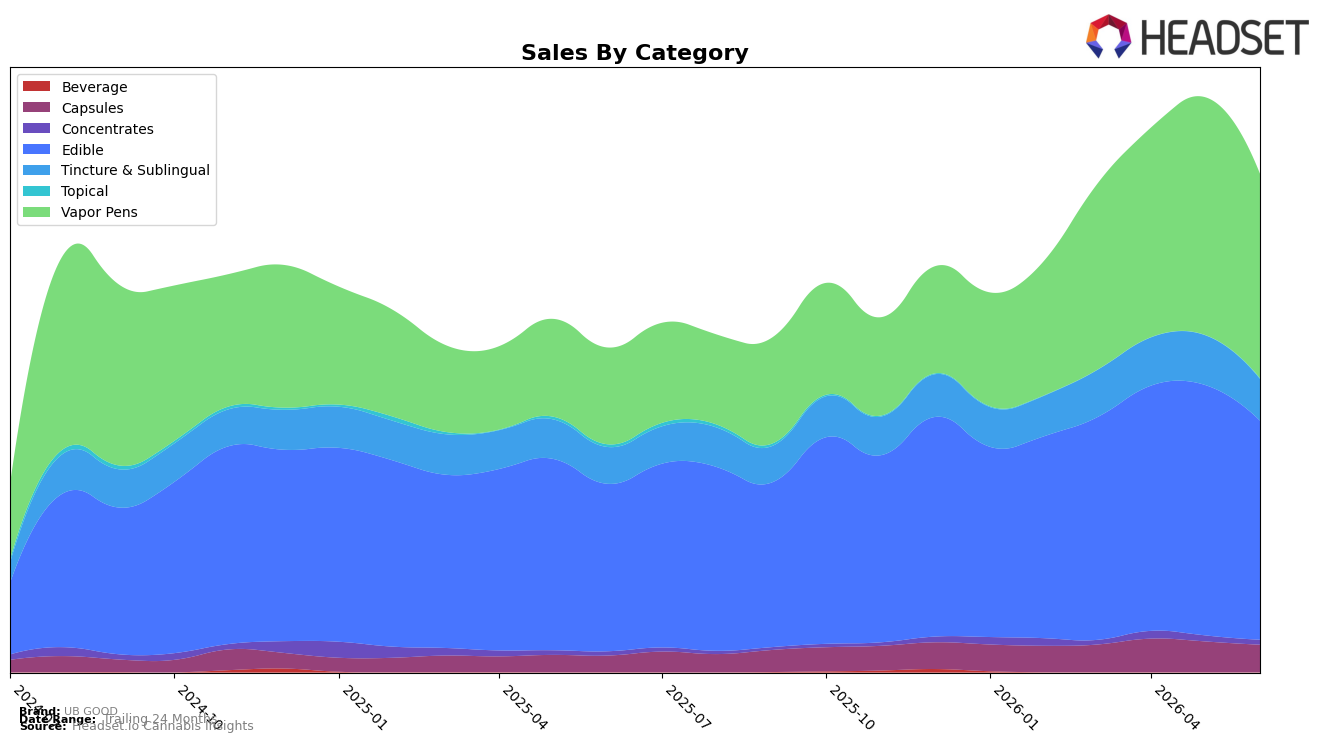
In June 2026, UB GOOD’s mix concentrated in Edible at 44.02% share with 30.93% YoY growth but a -12.54% MoM dip, while Vapor Pens held 41.06% share with 111.41% YoY growth and a -14.06% MoM pullback; Tincture & Sublingual reached 8.34% share on 13.49% YoY but fell -16.27% MoM. Capsules carried 5.51% share with 66.23% YoY growth and a -10.78% MoM decline, and Concentrates at 0.95% share grew 16.38% YoY but slipped -18.85% MoM; Topical contracted -77.65% YoY at 0.11% share. With overall brand sales up 53.74% YoY despite a price reduction of -0.45%, the pattern implies UB GOOD is leaning on a two-engine portfolio where Edible breadth and Vapor Pens velocity drive YoY gains, but synchronous MoM declines across five categories flag near-term demand softness or post-promo normalization.
This configuration positions UB GOOD to compete for basket leadership in Ohio Edibles, where it currently ranks 3, while the 41.06% share in Vapor Pens suggests headroom to convert trial driven by lower average price into repeat. The divergence—triple-digit YoY in Vapor Pens (111.41%) against smaller YoY in Tincture & Sublingual (13.49%) and Concentrates (16.38%), plus a Topical contraction of -77.65%—implies prioritization of inhalable and ingestible formats over niche therapeutics; the immediate implication is to protect Edible share above 44% while using Capsules’ 66.23% YoY as a margin-friendly extender when Pens face MoM volatility of -14.06% and Edibles -12.54%.
Competitive Landscape
UB GOOD sits at rank #3 in OH Edible in June 2026, down 1 position YoY from #2, and flat versus March 2026 at #3, while the brand’s peak was #1 in May 2025; meanwhile, Incredibles holds #1 with a 20.1% YoY sales increase and Gron / Grön climbed from #7 YoY to #2 on 79.4% YoY growth. Against that backdrop, Camino sits at #4 with a #3 YoY rank a year ago and 42.2% YoY growth, while Smokiez Edibles is at #5 with a flat #5 YoY and a -6.4% YoY decline, which places UB GOOD’s -1 rank shift alongside a stable #3 three-month position as evidence that share is being squeezed from above by faster-growing leaders rather than lost broadly across the tier.

Notable Products
Spark - Green Punch Distillate Cartridge (1g) posted the steepest retreat in June 2026, dropping 37.4% month over month to rank 10, while Blue Rush BDT Distillate Cartridge (1g) fell 22.8% at rank 3; together with Red Splash Distillate Cartridge (1g) down 33.4% at rank 6, Vapor Pens show concentrated downside at three positions inside the top ten. Cherry Pomegranate Extra Strength Releaf Gummies 10-Pack (500mg) held rank 1 despite a 22.5% month-over-month decline, and Pineapple Punch Extra Strength Gummies 10-Pack (500mg) slid 14.5% at rank 2, with four of the top ten being Edible SKUs that collectively out-rank the faltering pen lineup despite mixed momentum. The two CBD/THC 10:1 Juicy Pear Gummies SKUs at ranks 8 and 9 contracted 23.3% and 6.4% respectively, yet still preserved placement ahead of the lowest Vapor Pens SKU at rank 10, indicating category resilience even amid pullbacks. The pattern implies UB GOOD’s commercial direction is tilting toward maintaining Edibles as the lead volume engine while reassessing Vapor Pens where multiple double-digit declines suggest share at risk.
Top Selling Cannabis Brands
Data for this report comes from real-time sales reporting by participating cannabis retailers via their point-of-sale systems, which are linked up with Headset’s business intelligence software. Headset’s data is very reliable, as it comes digitally direct from our partner retailers. However, the potential does exist for misreporting in the instance of duplicates, incorrectly classified products, inaccurate entry of products into point-of-sale systems, or even simple human error at the point of purchase. Thus, there is a slight margin of error to consider. Brands listed on this page are ranked in the top twenty within the market and product category by total retail sales volume.

