Mar-2026
Sales
Trend
6-Month
Product Count
SKUs
Avg Price
YoY Sales Change
YoY Price Change
Market Insights Snapshot
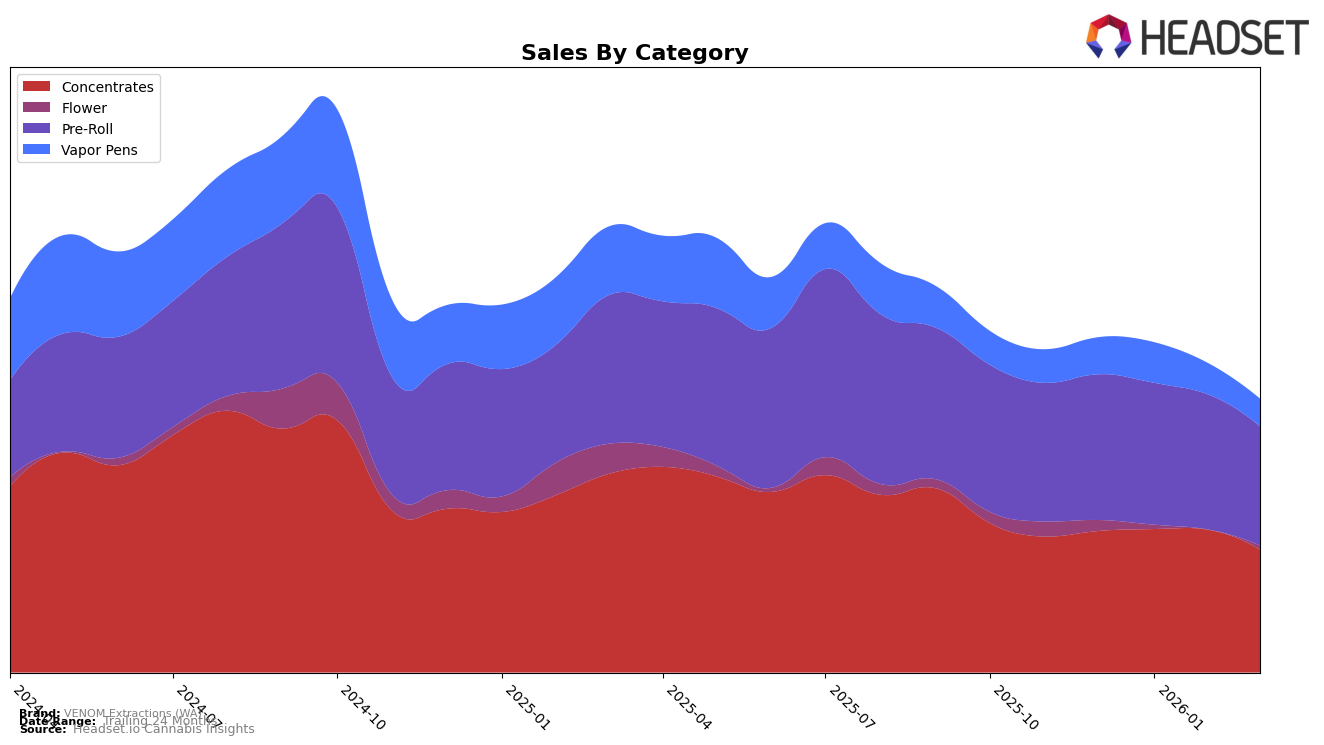
VENOM Extractions (WA) experienced fluctuating performance across its product categories in Washington. In the Concentrates category, the brand managed to stay within the top 30, though it saw a slight dip in its ranking from December 2025 to March 2026, moving from 26th to 30th place. This indicates a potential challenge in maintaining its competitive edge in this category. Despite this, the brand's sales figures showed some resilience, with only a minor decrease over the months, hinting at a stable consumer base that might be worth exploring further.
In contrast, VENOM Extractions (WA) faced more significant challenges in the Pre-Roll category. The brand's ranking fell from 47th in December 2025 to 52nd by March 2026, indicating a struggle to maintain its market position. The decline in sales during this period might suggest increasing competition or shifts in consumer preferences within the state. The fact that the brand did not make it into the top 30 in this category highlights a potential area for strategic improvement. This performance analysis suggests that while VENOM Extractions maintains a presence in the market, there are opportunities for growth and enhancement in both categories.
Competitive Landscape
In the Washington concentrates market, VENOM Extractions (WA) has experienced some fluctuations in its competitive standing, notably dropping from a rank of 23 in January 2026 to 30 by March 2026. This decline in rank is significant when compared to competitors like From the Soil, which improved its position from 36 to 28 during the same period, showcasing a positive trend in sales and market presence. Meanwhile, Sitka maintained a relatively stable rank, moving slightly from 31 to 29, suggesting a consistent market performance. SubX and Falcanna both experienced a decline in rank, similar to VENOM Extractions (WA), but with less pronounced sales figures. These dynamics highlight the competitive pressure VENOM Extractions (WA) faces, as it seeks to regain its earlier momentum and improve its standing in a market with shifting consumer preferences and strong competitors.

Notable Products
In March 2026, the top-performing product for VENOM Extractions (WA) was Alaskan Thunder Fuck Cured Resin (1g) in the Concentrates category, maintaining its number one rank from December 2025 and January 2026, after a slight dip to fourth in February. Baja Blast Infused Pre-Roll 2-Pack (1g) entered the rankings for the first time in March 2026, securing the second position with notable sales of 862 units. ATF Infused Pre-Roll 2-Pack (1g) consistently held the third position from February to March 2026, showing steady performance. Snoop's Dream Cured Resin (1g) debuted at fourth place in March 2026, indicating a strong entry into the market. 9lb Hammer Cured Resin (1g) reappeared at fifth place after being absent in February, having previously ranked second in December 2025 and third in January 2026.
Top Selling Cannabis Brands
Data for this report comes from real-time sales reporting by participating cannabis retailers via their point-of-sale systems, which are linked up with Headset’s business intelligence software. Headset’s data is very reliable, as it comes digitally direct from our partner retailers. However, the potential does exist for misreporting in the instance of duplicates, incorrectly classified products, inaccurate entry of products into point-of-sale systems, or even simple human error at the point of purchase. Thus, there is a slight margin of error to consider. Brands listed on this page are ranked in the top twenty within the market and product category by total retail sales volume.

