.svg)

Aug-2026
Sales
Trend
6-Month
Product Count
SKUs
Avg Price
YoY Sales Change
YoY Price Change


Market Insights Snapshot
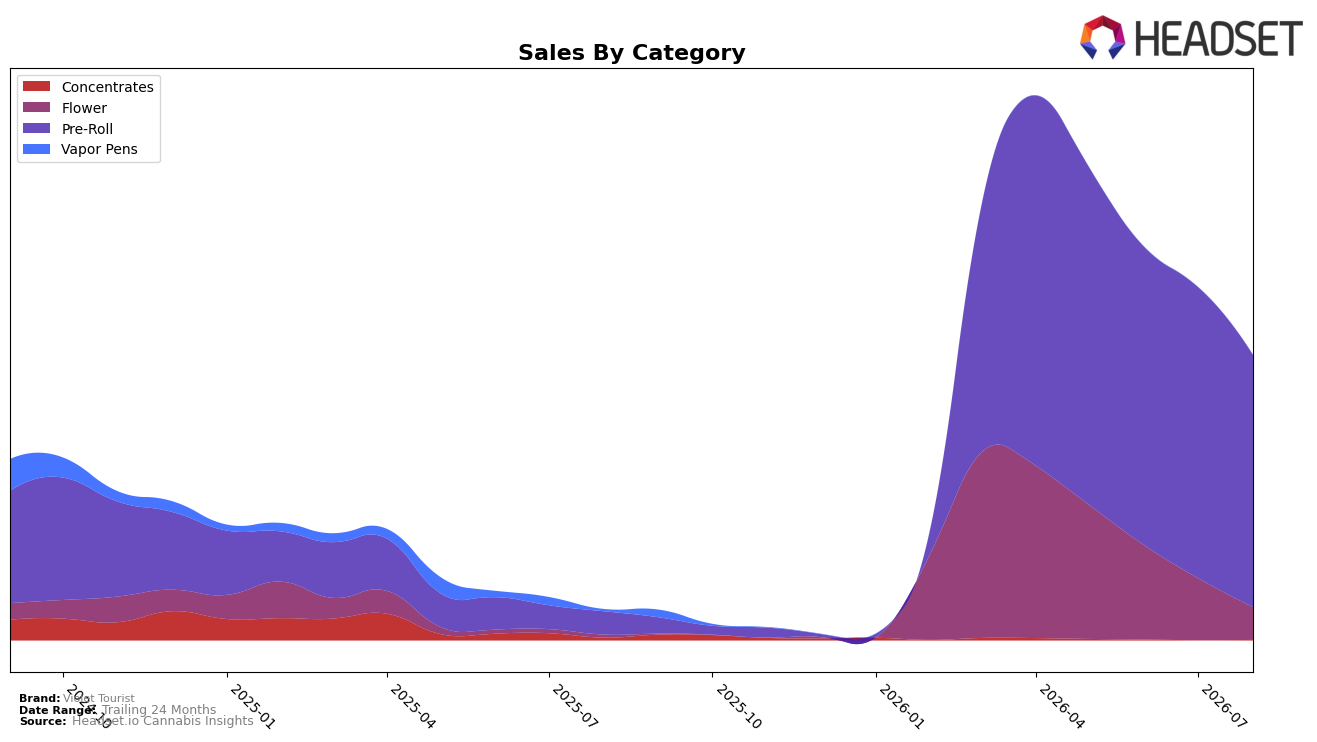
In August 2026, Violet Tourist concentrated 88.51% of sales in Pre-Roll with year-over-year growth of 1,000.37% but a month-over-month decline of 13.41%, while Flower held 11.39% share with an even larger 1,105.67% year-over-year increase and a sharper 47.53% month-over-month drop. Concentrates shrank to 0.10% share with a 88.81% year-over-year decline and no reported month-over-month figure, indicating a near exit from that segment. With an average price down 11.18% year over year to $24.33, the brand’s mix shift and concurrent price compression imply Violet Tourist is scaling volume in value-leaning Pre-Rolls while de-emphasizing higher-priced niches.
The mix concentration in Pre-Roll alongside a 44th rank in Pre-Roll within Alberta suggests breadth without top-tier placement, as the 13.41% month-over-month contraction in Pre-Roll and 47.53% month-over-month contraction in Flower point to sensitivity to short-cycle demand or promo cadence. The 1,000.37% and 1,105.67% year-over-year surges paired with an average price 11.18% lower imply a volume-led strategy that can win distribution slots but risks margin pressure and rank stagnation unless mix broadens beyond a 88.51% Pre-Roll dependency.
Competitive Landscape
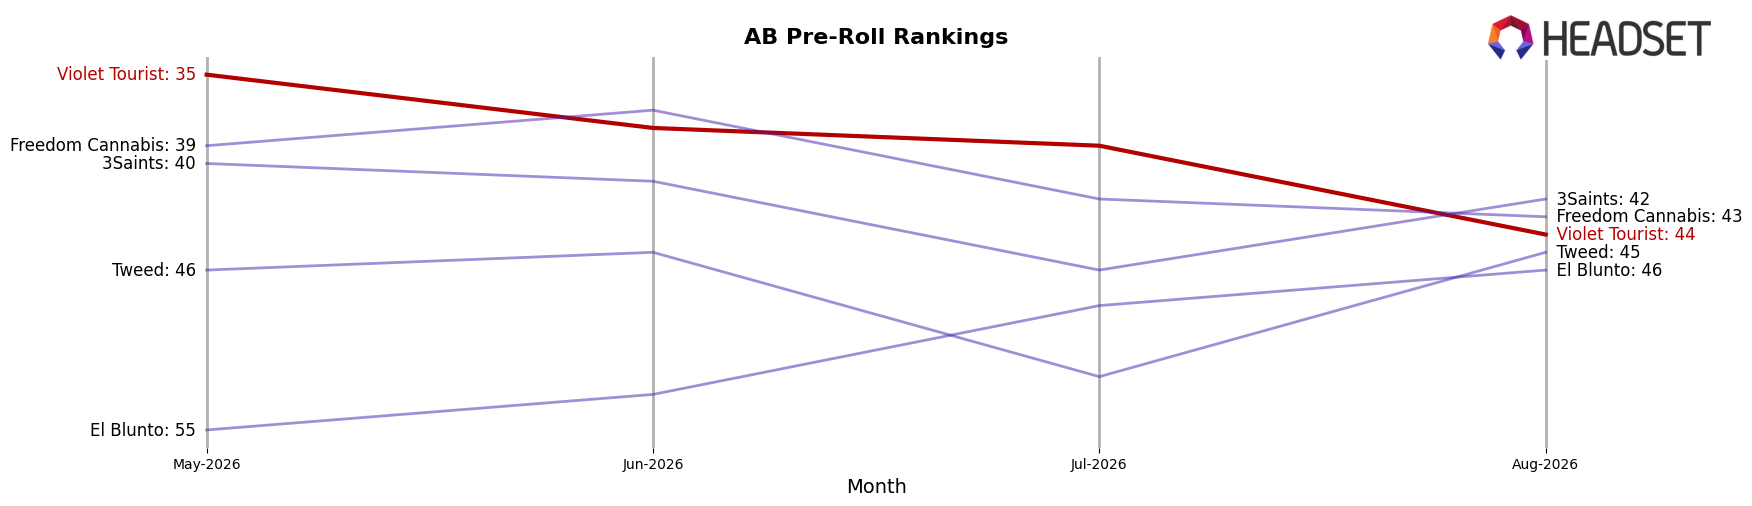
Violet Tourist sits at rank #44 in AB Pre-Roll in August 2026, a YoY climb of 162 positions from #206, but down 9 spots from #35 three months ago; its peak at #30 in April 2026 underscores a 14-place slide since that month and a 14-place gap back to that peak. Meanwhile, Back Forty / Back 40 Cannabis moved from #5 to #1 with a 50.3% YoY sales increase, while General Admission slipped from #1 to #2 with a 20.8% YoY decline, signaling that Violet Tourist’s rapid YoY rank recovery coexists with recent quarter-over-quarter softness, implying a rebound that risks stalling without renewed momentum.
Notable Products
Dooblicious Pre-Roll 3-Pack (1.5g) posted the largest month-over-month surge at 137.6% and rose to rank 3, while Chucklechamps Pre-Roll 15-Pack (15g) fell 58.7% and slid to rank 7. Scrumbiddlyumptious Pre-Roll 3-Pack (1.5g) jumped 53.0% to rank 1 and outpaced the flat-to-declining Puff Puff Variety Pack Pre-Roll 3-Pack (1.5g) at -2.9% in rank 4. With eight of the top ten being Pre-Roll SKUs and the 15-Pack format splitting between +75.4% for Snicker X Giggle X Chuckle-Bums at rank 6 and -58.7% for Chucklechamps at rank 7, August 2026 signals a pivot toward high-velocity hero SKUs and away from inconsistent multi-pack depth, concentrating revenue in a narrow set of winners.
Top Selling Cannabis Brands






Data for this report comes from real-time sales reporting by participating cannabis retailers via their point-of-sale systems, which are linked up with Headset’s business intelligence software. Headset’s data is very reliable, as it comes digitally direct from our partner retailers. However, the potential does exist for misreporting in the instance of duplicates, incorrectly classified products, inaccurate entry of products into point-of-sale systems, or even simple human error at the point of purchase. Thus, there is a slight margin of error to consider. Brands listed on this page are ranked in the top twenty within the market and product category by total retail sales volume.

